File:NumPy Matplotlib sin x plotted with red dots.svg

Size of this PNG preview of this SVG file: 576 × 432 pixels. Other resolutions: 320 × 240 pixels | 640 × 480 pixels | 1,024 × 768 pixels | 1,280 × 960 pixels | 2,560 × 1,920 pixels.
Original file (SVG file, nominally 576 × 432 pixels, file size: 25 KB)
Captions
Captions
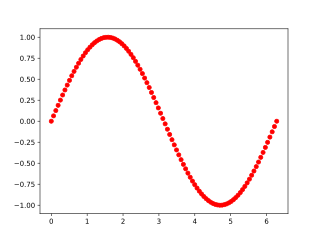
Plot of y=sin(x) function, created with NumPy and Matplotlib libraries
Summary
edit
| Description |
Русский: График функции y=sin(x), построенный с использованием библиотек NumPy и Matplotlib, в результате выполнения следующего кода:
import numpy as np
import matplotlib.pyplot as plt
# y = sin(x)
x = np.linspace(0, 2*np.pi, 100)
y = np.sin(x)
plt.plot(x, y,"ro")
plt.savefig('matplotlib_sin_x_red_dots.svg')
plt.show()
|
| Date | |
| Source | Own work |
| Author | MarsJson |
Licensing
edit
I, the copyright holder of this work, hereby publish it under the following license:
This file is licensed under the Creative Commons Attribution-Share Alike 4.0 International license.
- You are free:
- to share – to copy, distribute and transmit the work
- to remix – to adapt the work
- Under the following conditions:
- attribution – You must give appropriate credit, provide a link to the license, and indicate if changes were made. You may do so in any reasonable manner, but not in any way that suggests the licensor endorses you or your use.
- share alike – If you remix, transform, or build upon the material, you must distribute your contributions under the same or compatible license as the original.
File history
Click on a date/time to view the file as it appeared at that time.
| Date/Time | Thumbnail | Dimensions | User | Comment | |
|---|---|---|---|---|---|
| current | 00:02, 18 January 2024 | | 576 × 432 (25 KB) | MarsJson (talk | contribs) | Uploaded while editing "NumPy" on ru.wikipedia.org |
You cannot overwrite this file.
File usage on Commons
There are no pages that use this file.
File usage on other wikis
The following other wikis use this file: