File:OECD generic pharmaceuticals share.svg

Size of this PNG preview of this SVG file: 800 × 400 pixels. Other resolutions: 320 × 160 pixels | 640 × 320 pixels | 1,024 × 512 pixels | 1,280 × 640 pixels | 2,560 × 1,280 pixels | 1,440 × 720 pixels.
Original file (SVG file, nominally 1,440 × 720 pixels, file size: 78 KB)
Captions
Captions
Add a one-line explanation of what this file represents

|
This file may be updated to reflect new information. If you wish to use a specific version of the file without new updates being mirrored, please upload the required version as a separate file. |
Summary edit
| Description |
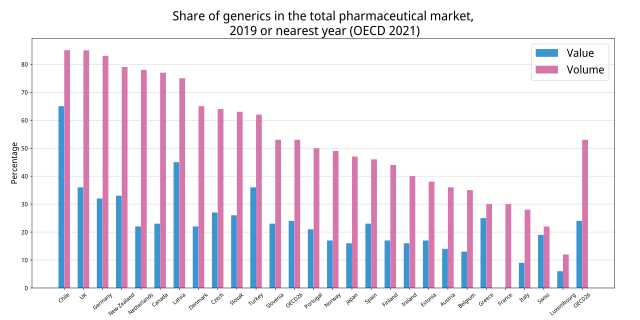
English: OECD HealthData, generic medicine market |
| Date | |
| Source | Own work |
| Author |
Yuasan, Data from OECD Health at a glance https://www.oecd-ilibrary.org/social-issues-migration-health/health-at-a-glance-2021_ae3016b9-en |
| Permission (Reusing this file) |
CC-0 |
Licensing edit
I, the copyright holder of this work, hereby publish it under the following license:
| This file is made available under the Creative Commons CC0 1.0 Universal Public Domain Dedication. | |
| The person who associated a work with this deed has dedicated the work to the public domain by waiving all of their rights to the work worldwide under copyright law, including all related and neighboring rights, to the extent allowed by law. You can copy, modify, distribute and perform the work, even for commercial purposes, all without asking permission.
|
Graph data edit
import matplotlib.pyplot as plt
import pandas as pd
import numpy as np

df = pd.read_csv("data.tsv", index_col=0 , sep = "\t")

fig, ax = plt.subplots(figsize=(16, 8))
x = np.arange(df.index.size)
ax.bar(x-0.15, df["Value"] , color="#3b95d3", width=0.3, bottom=0)
ax.bar(x+0.15, df["Volume"] , color="#D676AB", width=0.3, bottom=0)

ax.legend( ("Value", "Volume"),
		 fontsize=20,  loc='upper right',)
ax.set_axisbelow(True)

plt.rcParams['font.family'] = 'sans-serif'
plt.rcParams['font.sans-serif'] = ['Noto Sans Display']
plt.subplots_adjust(left=0.05, bottom=0.1, right=0.96, top=0.9)

plt.title("Share of generics in the total pharmaceutical market,\n 2019 or nearest year (OECD 2021)", fontsize=23)
plt.tick_params(labelsize=10, pad=4)
plt.xticks(x, df.index, rotation=40, size=10)

plt.ylabel("Percentage", size=15)
plt.yticks(fontsize=11)
plt.grid(which='major',color='#cccccc',linestyle='-', axis="y")
plt.subplots_adjust(top =0.88)

plt.savefig("image.svg")
File history
Click on a date/time to view the file as it appeared at that time.
| Date/Time | Thumbnail | Dimensions | User | Comment | |
|---|---|---|---|---|---|
| current | 10:03, 7 June 2022 | | 1,440 × 720 (78 KB) | Yuasan (talk | contribs) | 2019 data |
| 04:46, 4 July 2016 |  | 740 × 412 (96 KB) | Yuasan (talk | contribs) | Health at a glance 2015 | |
| 03:54, 13 January 2014 |  | 754 × 469 (130 KB) | Yuasan (talk | contribs) | User created page with UploadWizard |
You cannot overwrite this file.
File usage on Commons
The following page uses this file:
- File:Oecd-genericdrugmarket.svg (file redirect)
File usage on other wikis
The following other wikis use this file:
- Usage on ja.wikipedia.org