File:ParisLaw.png
Original file (1,429 × 1,259 pixels, file size: 85 KB, MIME type: image/png)
Captions
Captions

|
This graph image could be re-created using vector graphics as an SVG file. This has several advantages; see Commons:Media for cleanup for more information. If an SVG form of this image is available, please upload it and afterwards replace this template with
{{vector version available|new image name}}.
It is recommended to name the SVG file “ParisLaw.svg”—then the template Vector version available (or Vva) does not need the new image name parameter. |
Summary
edit| Description |
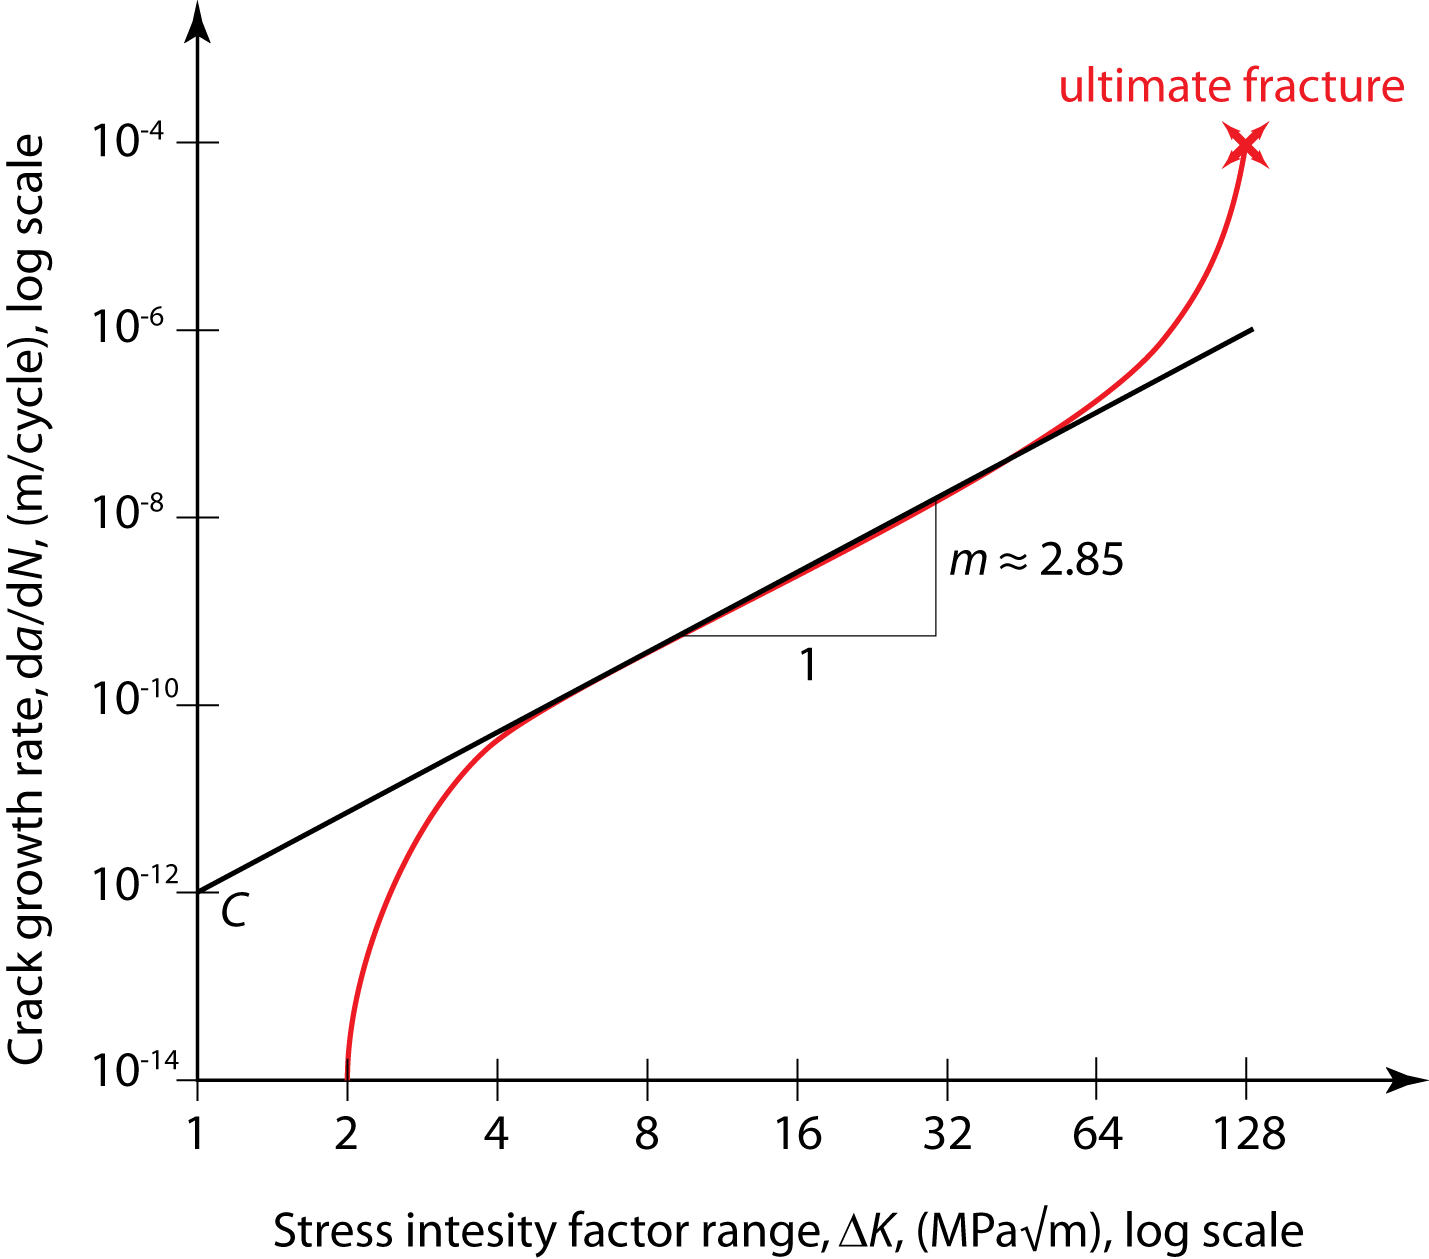
English: (Paris' law)
For a typical fatigue crack growth process, the crack growth rate is plotted over the range of the stress intensity factor (in red). Paris' law is fitted to quasi-linear part of this curve (in black). The crack growth rate, da/dN, denotes the change in crack length, a, with increasing number of load cycles, N. The range of the stress intensity factor, K, depends on the magnitude of the loading, the geometry, and the crack length. Both quantities (i.e., da/dN and K) evolve during the fatigue process until the specimen fails. On a log-log plot, the two Paris law model parameters, C and m, can be determined graphically as the y-axis intersect at x=1 and the slope, respectively. The values of the model shown here, i.e., C=10-12 and m=2.85, are typical for, e.g., aluminum. |
| Date | |
| Source | Own work |
| Author | Tomeasy |


Licensing
edit
- You are free:
- to share – to copy, distribute and transmit the work
- to remix – to adapt the work
- Under the following conditions:
- attribution – You must give appropriate credit, provide a link to the license, and indicate if changes were made. You may do so in any reasonable manner, but not in any way that suggests the licensor endorses you or your use.
- share alike – If you remix, transform, or build upon the material, you must distribute your contributions under the same or compatible license as the original.
File history
Click on a date/time to view the file as it appeared at that time.
| Date/Time | Thumbnail | Dimensions | User | Comment | |
|---|---|---|---|---|---|
| current | 22:35, 22 July 2010 | | 1,429 × 1,259 (85 KB) | Tomeasy (talk | contribs) | {{Information |Description={{en|1=For a typical fatigue crack growth process, the crack growth rate is plotted over the the range of the stress intensity factor (in red). Paris' law is fitted to this curve (in black). On a log-log plot, as shown here, th |
You cannot overwrite this file.
File usage on Commons
There are no pages that use this file.
File usage on other wikis
The following other wikis use this file:
- Usage on fa.wikipedia.org
- Usage on pt.wikipedia.org
- Usage on ro.wikipedia.org