File:Plot of decibel and inverse.pdf
No higher resolution available.
Plot_of_decibel_and_inverse.pdf (410 × 408 pixels, file size: 14 KB, MIME type: application/pdf)
Captions
Captions
Add a one-line explanation of what this file represents
Summary edit
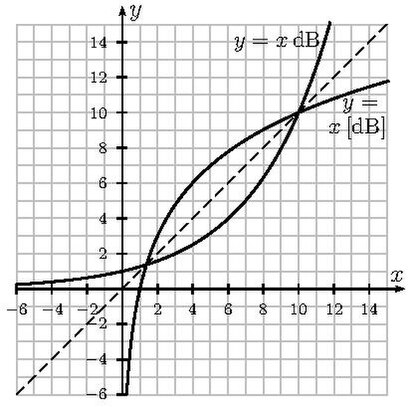
| Description | Plot (graph) of the decibel function and its inverse |
| Date | |
| Source | Own work |
| Author | Boute (Boute (talk)) |
Clarification edit
(Click on the plot to enlarge) The plot represents the decibel scaling function dB and its inverse, defined by
- for real-valued x;

- for strictly positive real-valued x. Note: is read " x in dB or " x expressed in dB".
![{\displaystyle x\,[\mathrm {dB} ]=10\,\mathrm {lg} \,x}](https://wikimedia.org/api/rest_v1/media/math/render/svg/9692fa79d23ba7f72b41d7eb2b38307bbe10dbec)
![{\displaystyle [\mathrm {dB} ]}](https://wikimedia.org/api/rest_v1/media/math/render/svg/2a507bc8e1e5ae988e06a3790fa6d4614fd615e4)
Examples
- (1) Illustrating the functions: and ; conversely: and .


![{\displaystyle 2\,[\mathrm {dB} ]=3}](https://wikimedia.org/api/rest_v1/media/math/render/svg/a2745457afaf9e6ac19915d5e045703b26ede066)
![{\displaystyle 1000\,[\mathrm {dB} ]=30}](https://wikimedia.org/api/rest_v1/media/math/render/svg/7b5761455de7290cbf140bb20f9bbd34ed19ab01)
- (2) A representative application: let input power , output power and gain be related by . Then one can write rigorously the following
- (a)
- (b) instantiating with and and yields
- (c) numerical example: is equivalent to


![{\displaystyle G\,[\mathrm {dB} ]+P\,[\mathrm {dBW} ]=P'\,[\mathrm {dBW} ]}](https://wikimedia.org/api/rest_v1/media/math/render/svg/ad1dc209bbc26cc4f21850db3ee4844e139cc361)


- (3) Conversion to scientific notation: , for instance .


The scientific notation example shows that the graph for the interval from 0 to 10 suffices for calculating quick approximations for any argument value. Boute (talk) 05:25, 29 March 2012 (UTC)
Licensing edit
I, the copyright holder of this work, hereby publish it under the following licenses:
This file is licensed under the Creative Commons Attribution-Share Alike 3.0 Unported license.
- You are free:
- to share – to copy, distribute and transmit the work
- to remix – to adapt the work
- Under the following conditions:
- attribution – You must give appropriate credit, provide a link to the license, and indicate if changes were made. You may do so in any reasonable manner, but not in any way that suggests the licensor endorses you or your use.
- share alike – If you remix, transform, or build upon the material, you must distribute your contributions under the same or compatible license as the original.

|
Permission is granted to copy, distribute and/or modify this document under the terms of the GNU Free Documentation License, Version 1.2 or any later version published by the Free Software Foundation; with no Invariant Sections, no Front-Cover Texts, and no Back-Cover Texts. A copy of the license is included in the section entitled GNU Free Documentation License. |
You may select the license of your choice.
File history
Click on a date/time to view the file as it appeared at that time.
| Date/Time | Thumbnail | Dimensions | User | Comment | |
|---|---|---|---|---|---|
| current | 15:45, 31 July 2010 |  | 410 × 408 (14 KB) | Boute (talk | contribs) | {{Information |Description=Plot (graph) of the decibel function and its inverse |Source={{own}} |Date=2010/07/31 |Author= Boute (~~~) |Permission= see below |other_versions=none }} |
You cannot overwrite this file.
File usage on Commons
There are no pages that use this file.