File:Population curve of Uruk 1.svg

Original file (SVG file, nominally 1,080 × 540 pixels, file size: 33 KB)
Captions
Captions
Summary edit
| Description |
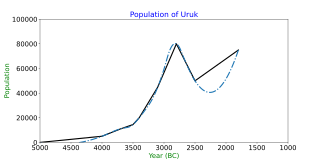
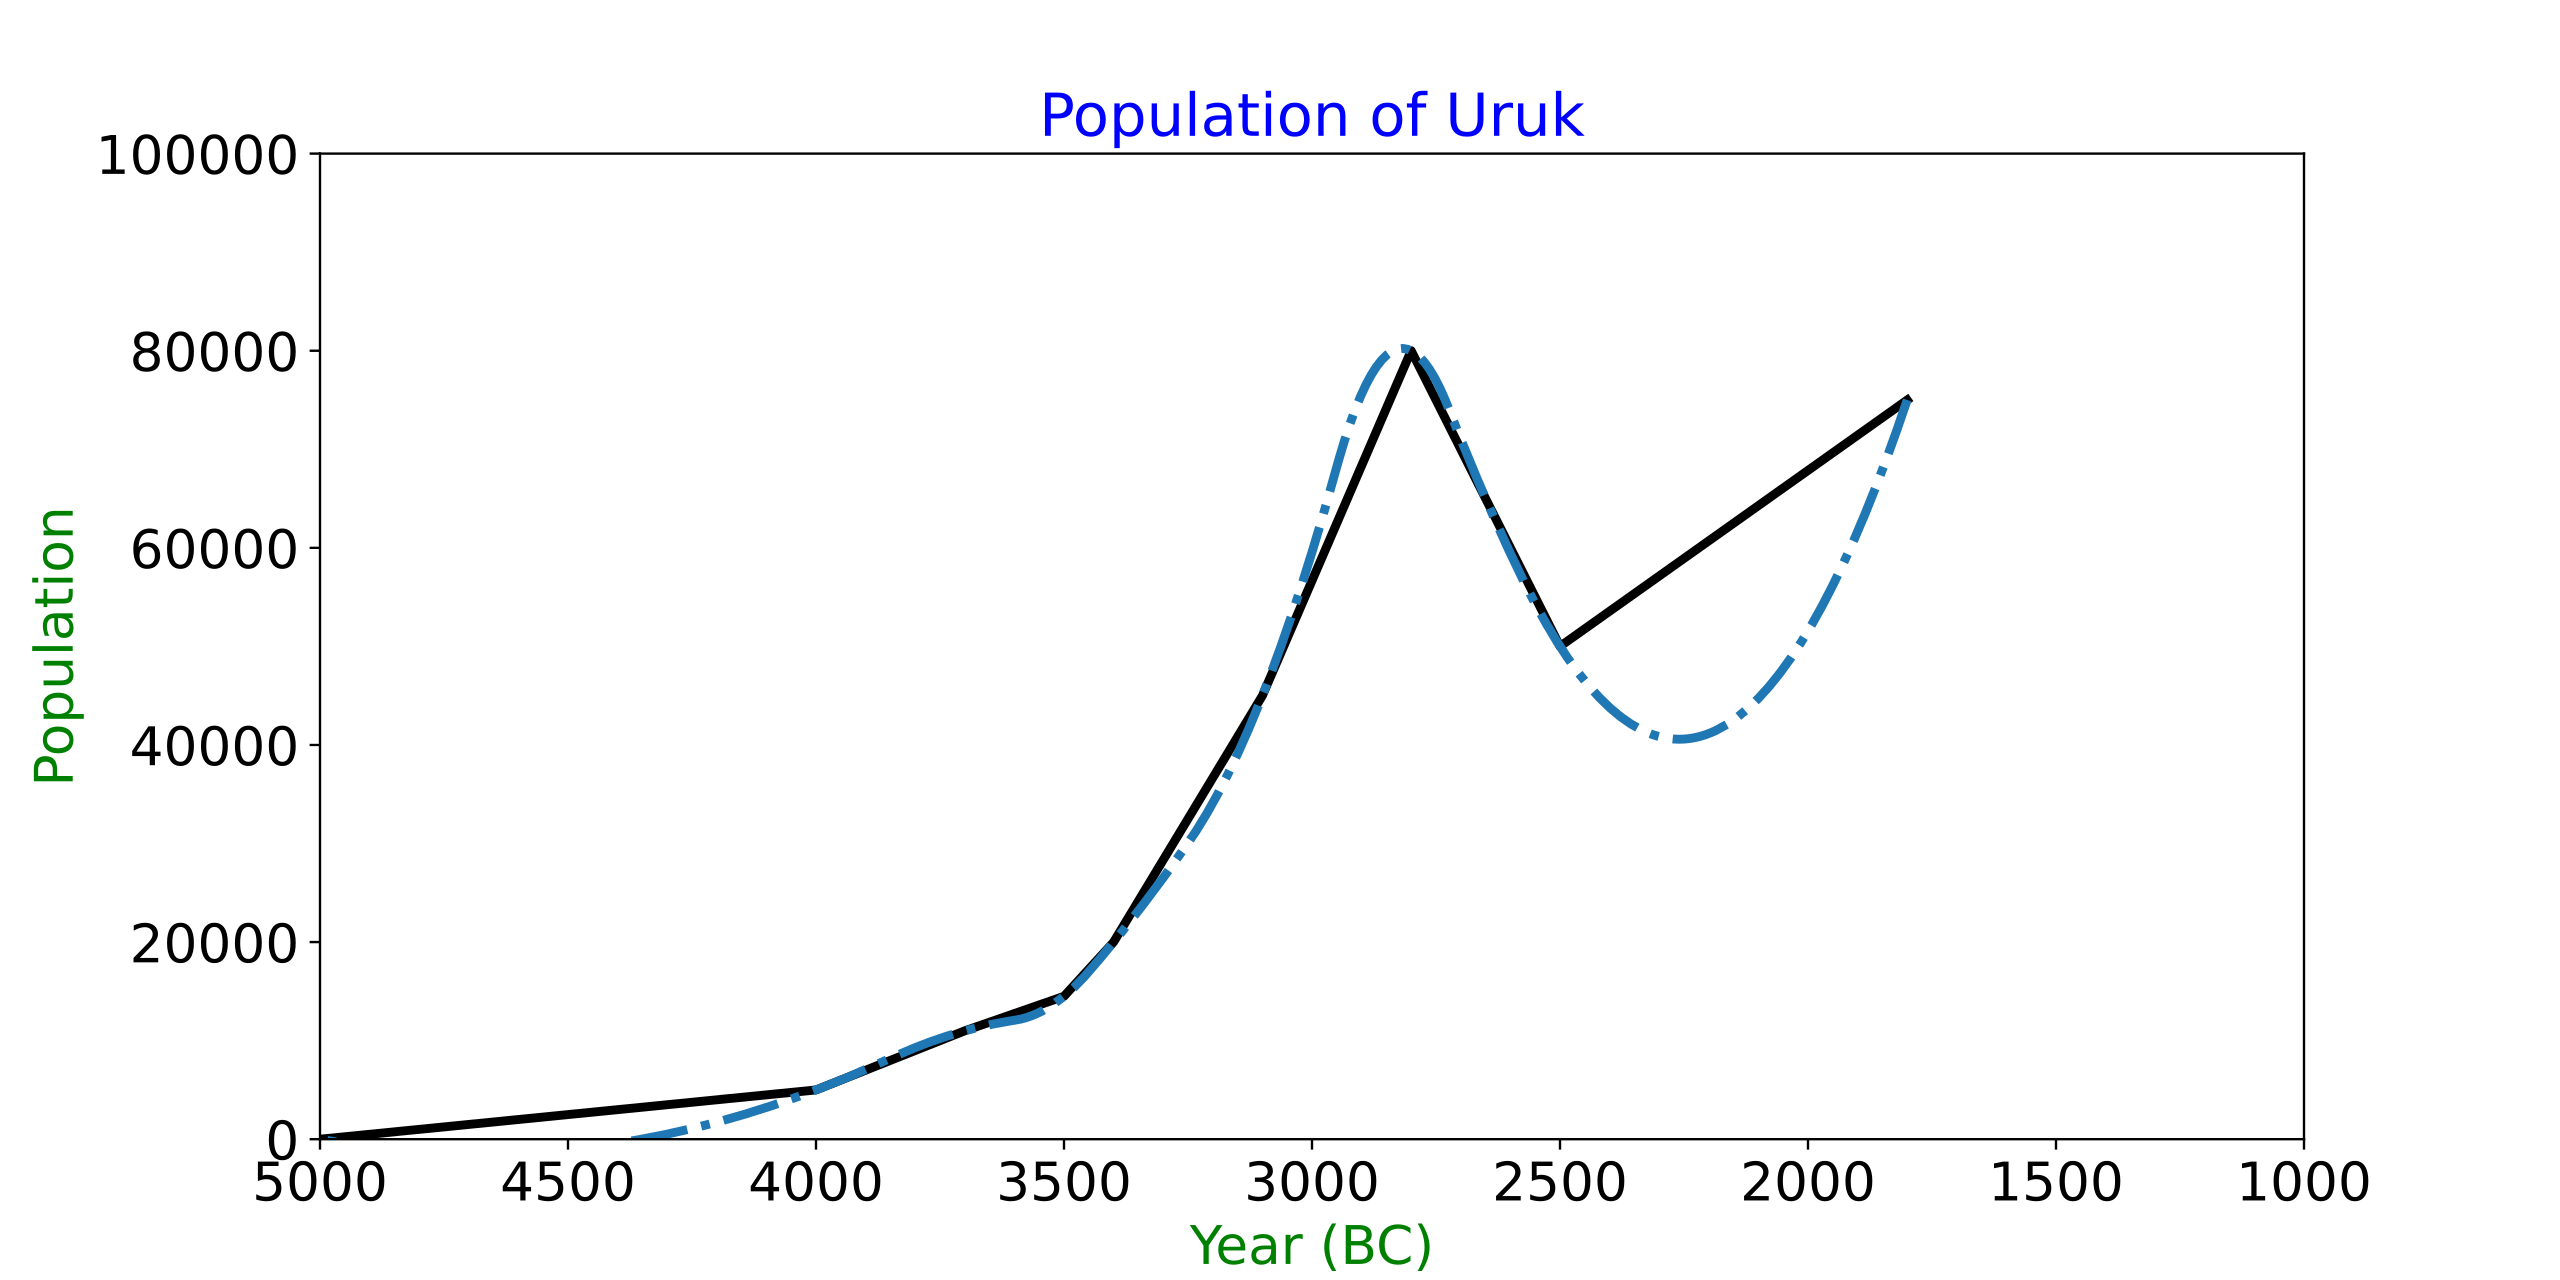
English: Population curve of ancient Uruk. |
| Date | |
| Source | Own work |
| Author | Merikanto |
| Camera location | | View this and other nearby images on: OpenStreetMap |
|---|
This plot is based on info from Finnish Wikipedia.
https://fi.wikipedia.org/wiki/Uruk
Data
bc;est_pop;pop_lower;pop_upper
5000;0;0;0
4000;5000;5000;5000
3700;11000;8000;14000
3500;14500;14000;15000
3400;20000;20000;2000
3100;45000;40000;50000
2800;80000;80000;80000
2650;65000;50000;80000
2500;50000;50000;50000
1800;75000;75000;75000
Python code
- uruk population Python 3 code
import matplotlib
import matplotlib.pyplot as plt
import numpy as np
import pandas as pd
from scipy.interpolate import interp1d
df = pd.read_csv(r'uruk2.csv', delimiter=';')
- bc;est_pop;pop_lower;pop_upper
years1=np.array(df['bc'])
pop1=np.array(df['est_pop'])
pop_lower1=np.array(df['pop_lower'])
pop_upper1=np.array(df['pop_upper'])
print (years1)
years_new1 = np.linspace(years1.min(), years1.max(), 300)
- pop_smooth1 = spline(years1, pop1, years_new1)
- funk1 = interp1d(years1, pop1, kind='cubic')
funk1 = interp1d(years1, pop1, kind='quadratic')
funk_lower1 = interp1d(years1, pop_lower1, kind='quadratic')
funk_upper1 = interp1d(years1, pop_upper1, kind='quadratic')
- ‘linear’, ‘nearest’, ‘zero’, ‘slinear’, ‘quadratic’, ‘cubic’, ‘previous’, ‘next’, where ‘zero’, ‘slinear’, ‘quadratic’ and ‘cubic’
pop_new1 = funk1(years_new1)
pop_new_lower1 = funk_lower1(years_new1)
pop_new_upper1 = funk_upper1(years_new1)
- quit()
fig, ax = plt.subplots(figsize=(12.0,6.0))
- ax.legend(title='Population of Uruk')
ax.set_xlabel('Year (BC)', color='g',size=18)
ax.set_ylabel('Population', color='g',size=18)
ax.set_title('Population of Uruk', color='b',size=20)
ax.set_xlim([5000, 1000])
ax.set_ylim([0.0, 100000])
ax.tick_params(axis='x',labelsize=18 )
ax.tick_params(axis='y',labelsize=18 )
- ax.plot(years1, pop1)
- ax.plot(years_new1, pop_new1, lw=3)
- ax.plot( years1, pop1, 'o', color='b',years_new1, pop_new1,'-', color='g', lw=3)
ax.plot( years1, pop1, 'black',years_new1, pop_new1,'-.', lw=3)
- ax.fill_between(years1, pop_lower1, pop_upper1,color='k', alpha=.1, lw=0,label='Confidence')
- ax.fill_between(years_new1, pop_new_lower1, pop_new_upper1,color='k', alpha=.1, lw=0,label='Confidence')
- ax.legend();
plt.savefig("c:/Users/luser/Population curve of Uruk 1.svg")
plt.show()
Licensing edit
- You are free:
- to share – to copy, distribute and transmit the work
- to remix – to adapt the work
- Under the following conditions:
- attribution – You must give appropriate credit, provide a link to the license, and indicate if changes were made. You may do so in any reasonable manner, but not in any way that suggests the licensor endorses you or your use.
- share alike – If you remix, transform, or build upon the material, you must distribute your contributions under the same or compatible license as the original.
File history
Click on a date/time to view the file as it appeared at that time.
| Date/Time | Thumbnail | Dimensions | User | Comment | |
|---|---|---|---|---|---|
| current | 07:01, 15 July 2020 | | 1,080 × 540 (33 KB) | Merikanto (talk | contribs) | Uploaded own work with UploadWizard |
You cannot overwrite this file.
File usage on Commons
There are no pages that use this file.
File usage on other wikis
The following other wikis use this file:
- Usage on fi.wikipedia.org