File:Productive efficiency.svg

Size of this PNG preview of this SVG file: 560 × 400 pixels. Other resolutions: 320 × 229 pixels | 640 × 457 pixels | 1,024 × 731 pixels | 1,280 × 914 pixels | 2,560 × 1,829 pixels.
Original file (SVG file, nominally 560 × 400 pixels, file size: 4 KB)
Captions
Captions
Add a one-line explanation of what this file represents
| Description |
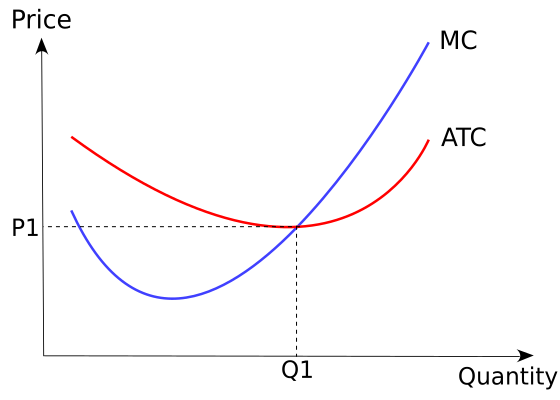
English: The marginal and average total cost curves, illustrating the point (Q1, P1) at which productive efficiency is achieved (MC=ATC a.k.a. AC). |
| Date | (UTC) |
| Source | |
| Author |
|
| Other versions |
File:Productive efficiency.svg has 2 translations.
|


This file is licensed under the Creative Commons Attribution-Share Alike 3.0 Unported license.
- You are free:
- to share – to copy, distribute and transmit the work
- to remix – to adapt the work
- Under the following conditions:
- attribution – You must give appropriate credit, provide a link to the license, and indicate if changes were made. You may do so in any reasonable manner, but not in any way that suggests the licensor endorses you or your use.
- share alike – If you remix, transform, or build upon the material, you must distribute your contributions under the same or compatible license as the original.
Original upload log edit
This image is a derivative work of the following images:
- File:Costcurve_-_Combined.png licensed with Cc-by-2.0
- 2010-09-26T19:05:28Z File Upload Bot (Magnus Manske) 280x258 (12960 Bytes) {{BotMoveToCommons|en.wikipedia|year={{subst:CURRENTYEAR}}|month={{subst:CURRENTMONTHNAME}}|day={{subst:CURRENTDAY}}}} {{Information |Description={{en|[[:en:Category:Economics curves|]]}} |Source=Transferred from [http://en.
Uploaded with derivativeFX
File history
Click on a date/time to view the file as it appeared at that time.
| Date/Time | Thumbnail | Dimensions | User | Comment | |
|---|---|---|---|---|---|
| current | 20:25, 3 October 2023 | | 560 × 400 (4 KB) | KajenCAT (talk | contribs) | File uploaded using svgtranslate tool (https://svgtranslate.toolforge.org/). Added translation for ca. |
| 20:25, 3 October 2023 |  | 560 × 400 (4 KB) | KajenCAT (talk | contribs) | File uploaded using svgtranslate tool (https://svgtranslate.toolforge.org/). Added translation for ca. | |
| 18:46, 27 September 2010 |  | 560 × 400 (3 KB) | Jarry1250 (talk | contribs) | {{Information |Description={{en|The marginal and average total cost curves, illustrating the point (Q1, P1) at which en:productive efficency is achieved (MC=ATC a.k.a. AC).}} |Source=*File:Costcurve_-_Combined.png |Date=2010 |
You cannot overwrite this file.
File usage on Commons
The following page uses this file:
File usage on other wikis
The following other wikis use this file:
- Usage on ca.wikipedia.org
- Usage on en.wikipedia.org
- Usage on es.wikipedia.org
- Usage on pt.wikipedia.org
- Usage on simple.wikipedia.org