File:Q-plate for OAM 1.svg

Size of this PNG preview of this SVG file: 439 × 599 pixels. Other resolutions: 176 × 240 pixels | 352 × 480 pixels | 563 × 768 pixels | 750 × 1,024 pixels | 1,501 × 2,048 pixels | 2,500 × 3,411 pixels.
Original file (SVG file, nominally 2,500 × 3,411 pixels, file size: 1.33 MB)
Captions
Captions
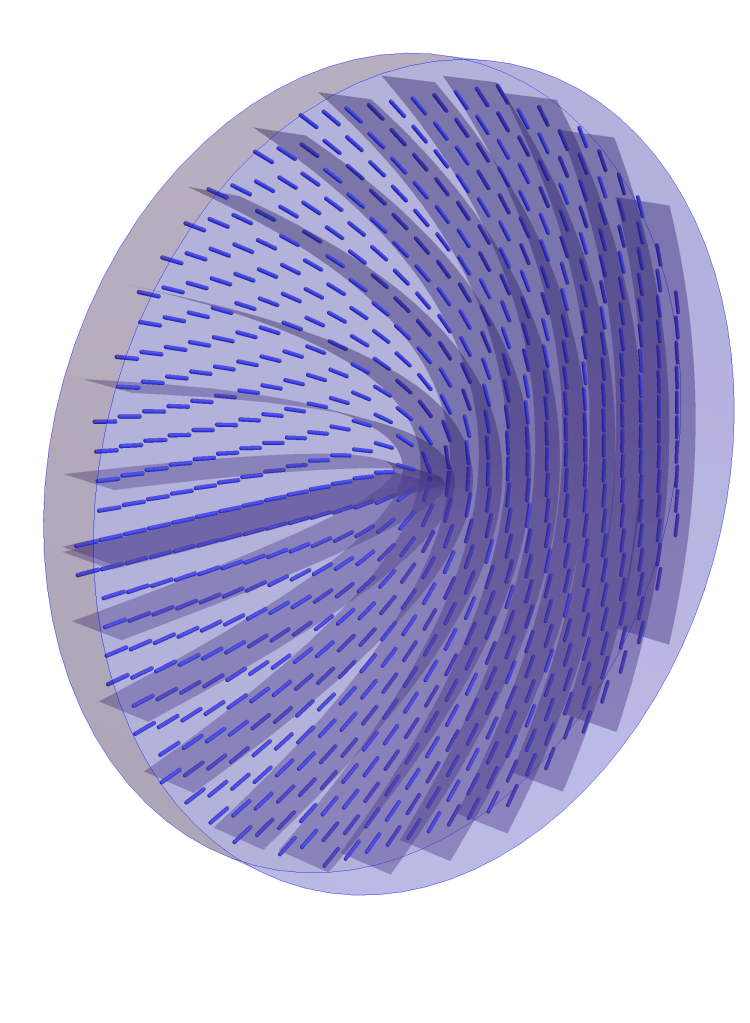
q-plate with q = 1/2
Summary edit
| Description |
English: Schematic depiction of a q-plate with q = 1/2 that can be used to transform a circularly-polarized Gaussian light beam into a beam with helical wavefronts with a unit pitch. For details see: [Marrucci et al., Phys. Rev. Lett. 96, 163905, DOI:10.1103/PhysRevLett.96.163905]. Čeština: Schematické vyobrazení q-destičky s q = 1/2, jíž lze užít pro transformaci kruhově polarizovaného Gaussovského svazku světla na svazek se šroubovicovitými vlnoplochami s jednotkovým stoupáním. Pro bližší informace viz: [Marrucci et al., Phys. Rev. Lett. 96, 163905, DOI:10.1103/PhysRevLett.96.163905]. |
| Date | |
| Source | Own work |
| Author | JozumBjada |
Licensing edit
I, the copyright holder of this work, hereby publish it under the following license:
This file is licensed under the Creative Commons Attribution-Share Alike 4.0 International license.
- You are free:
- to share – to copy, distribute and transmit the work
- to remix – to adapt the work
- Under the following conditions:
- attribution – You must give appropriate credit, provide a link to the license, and indicate if changes were made. You may do so in any reasonable manner, but not in any way that suggests the licensor endorses you or your use.
- share alike – If you remix, transform, or build upon the material, you must distribute your contributions under the same or compatible license as the original.
Source code edit
This figure was created using Wolfram language 12.0.0 for Microsoft Windows (64-bit) (April 6, 2019). The source code follows (formatted as a .wl package file).
(* ::Package:: *)

(* ::Title:: *)
(*Q-Plate*)


(* ::Subtitle:: *)
(*q-plate with q = 1/2*)


(* ::Input::Initialization:: *)
curve[a_,y_]:=-(1/2) E^(-2 a) (E^(4 a)-y^2)
avals=(1/2. Log[-2#])&/@{-1.5,-1.4,-1.3,-1.2,-1.1,-1.,-0.9,-0.8,-0.7,-0.6,-0.5,-0.4,-0.3,-0.2,-0.1,-4*^-2,-8*^-3,-1*^-5};
plot=Plot[Evaluate@Flatten@Table[curve[a,y],{a,avals}],{y,-1,1},PlotStyle->Darker@LightBlue,PlotRange->{-1,1},RegionFunction->(#1^2+#2^2<=1&),AspectRatio->1,Axes->False];


(* ::Input::Initialization:: *)
lines=Cases[InputForm[plot],_Line,Infinity];
lines=Show@RegionProduct[DiscretizeGraphics[lines],MeshRegion[{{0},{.2}},Line[{1,2}]]];
surfaces=GraphicsComplex[lines[[1,1]],lines[[1,2,-1]]];


(* ::Input::Initialization:: *)
plottubes=With[{f=1/2 ArcTan[y,-x]},VectorPlot[{Cos[f],Sin[f]},{x,-1,1},{y,-1,1},VectorMarkers->None,RegionFunction->(#1^2+#2^2<=1&),Frame->None,PlotRangePadding->None,VectorStyle->Thick,VectorScale->0.02,VectorPoints->30]];
tubes=Cases[InputForm[plottubes],_Line,Infinity];
tubes=tubes/.{x_?NumericQ,y_?NumericQ}:>{x,y,0.1}/.Line[l_]:>Tube[l,0.005];


(* ::Input::Initialization:: *)
qplate=Graphics3D[{
Lighter@Blue,tubes,EdgeForm[],Opacity[.4],Rotate[surfaces,- \[Pi],{0,0,1}],Opacity[.2],EdgeForm[Blue],Cylinder[{{0,0,0},{0,0,0.2}},1.05]
},ImageSize->2000,Boxed->False,Method->{"CylinderPoints"->80},ViewPoint->{-0.871,-2.1271,2.4871},ViewVertical->{-0.23839,-0.073117,0.96841}
];


(* ::Input:: *)
(*SetDirectory[NotebookDirectory[]]*)
(*Export["qplate.svg",gr]*)
File history
Click on a date/time to view the file as it appeared at that time.
| Date/Time | Thumbnail | Dimensions | User | Comment | |
|---|---|---|---|---|---|
| current | 20:32, 26 January 2022 | | 2,500 × 3,411 (1.33 MB) | JozumBjada (talk | contribs) | Cross-wiki upload from cs.wikipedia.org |
You cannot overwrite this file.
File usage on Commons
There are no pages that use this file.
File usage on other wikis
The following other wikis use this file:
- Usage on cs.wikipedia.org