File:Ratio of traffic mode in passenger transport in Germany 2002.png
No higher resolution available.
Ratio_of_traffic_mode_in_passenger_transport_in_Germany_2002.png (618 × 523 pixels, file size: 17 KB, MIME type: image/png)
Captions
Captions
Add a one-line explanation of what this file represents
Summary edit
| Description |
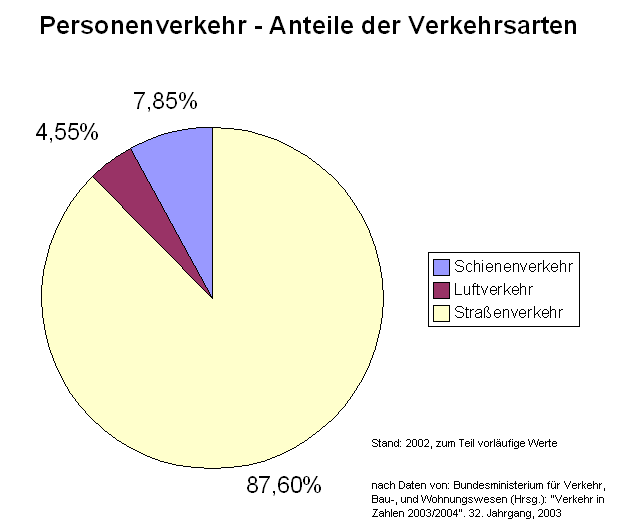
English: The graphic shows in which ratios each traffic mode is used for passenger transport in Germany in 2002.
Deutsch: Die Grafik zeigt, welche Anteile an der Verkehrsleistung (Personen * Kilometer) die einzelnen Verkehrsmittel im binnenländischen Personenverkehr in Deutschland im Jahr 2002 hatten. Schienenverkehr inklusive S-Bahn, aber ohne Stadtschnellbahn- (U-Bahn-), Straßenbahn-, Obus- und Kraftomnibusverkehr, welcher zu Straßenverkehr gezählt wurde. Ohne Ein- und Durchfahrten ausländischer Unternehmen im öffentlichen Straßenpersonenverkehr |
| Date | |
| Source | own work with data from Bundesministerium für Verkehr, Bau- und Wohnnungswesen (Hrsg): Verkehr in Zahlen 2003/2004. 32. Jahrgang, 2003, ISBN 3871542946, S. 215 |
| Author | Malte Schierholz |
| Permission (Reusing this file) |
own work |
| Other versions | similar: http://de.wikipedia.org/wiki/Bild:Verkehrsleistung_Anteil.jpg |
Licensing edit
I, the copyright holder of this work, hereby publish it under the following licenses:

|
Permission is granted to copy, distribute and/or modify this document under the terms of the GNU Free Documentation License, Version 1.2 or any later version published by the Free Software Foundation; with no Invariant Sections, no Front-Cover Texts, and no Back-Cover Texts. A copy of the license is included in the section entitled GNU Free Documentation License. |
| This file is licensed under the Creative Commons Attribution-Share Alike 3.0 Unported license. | ||
| ||
| This licensing tag was added to this file as part of the GFDL licensing update. |
This file is licensed under the Creative Commons Attribution-Share Alike 2.5 Generic, 2.0 Generic and 1.0 Generic license.
- You are free:
- to share – to copy, distribute and transmit the work
- to remix – to adapt the work
- Under the following conditions:
- attribution – You must give appropriate credit, provide a link to the license, and indicate if changes were made. You may do so in any reasonable manner, but not in any way that suggests the licensor endorses you or your use.
- share alike – If you remix, transform, or build upon the material, you must distribute your contributions under the same or compatible license as the original.
You may select the license of your choice.
File history
Click on a date/time to view the file as it appeared at that time.
| Date/Time | Thumbnail | Dimensions | User | Comment | |
|---|---|---|---|---|---|
| current | 13:54, 18 October 2006 | | 618 × 523 (17 KB) | Malte Schierholz~commonswiki (talk | contribs) | {{Information |Description=* en: The graphic shows in which ratios each traffic mode is used for passenger transport in Germany in 2002. * de: Die Grafik zeigt, welche Anteile an der Verkehrsleistung (Personen * Kilometer) die einzelnen Verkehrsarten im |
You cannot overwrite this file.
File usage on Commons
There are no pages that use this file.
File usage on other wikis
The following other wikis use this file:
- Usage on de.wikipedia.org