File:Reciprocal population.PNG

Original file (2,674 × 1,912 pixels, file size: 32 KB, MIME type: image/png)
Captions
Captions
Format edit

|
This graph image could be re-created using vector graphics as an SVG file. This has several advantages; see Commons:Media for cleanup for more information. If an SVG form of this image is available, please upload it and afterwards replace this template with
{{vector version available|new image name}}.
It is recommended to name the SVG file “Reciprocal population.svg”—then the template Vector version available (or Vva) does not need the new image name parameter. |
Summary edit
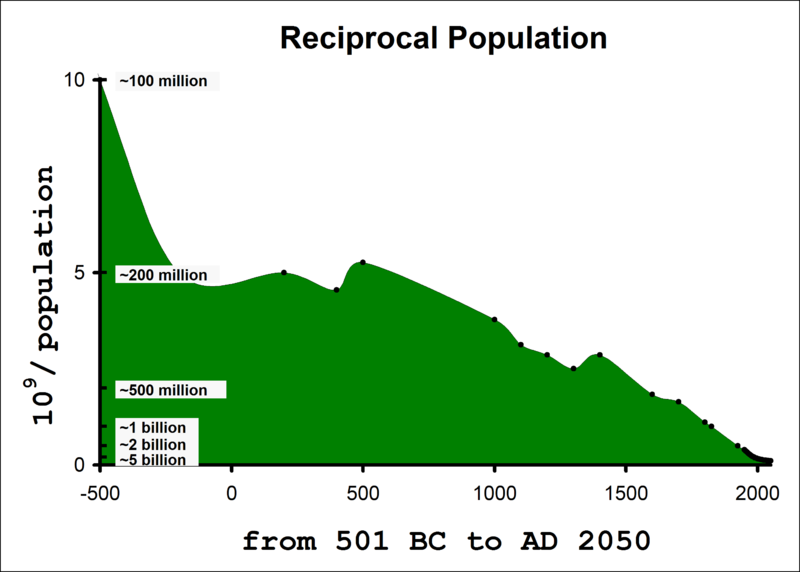
Graph showing one billion divided by estimated human population of the World, from year 501 BC to 2050 AD.
Shows development in available land area, or in any other constant resource, per capita. (The actually arable land area has not been a constant resource in that period.)
Note the almost linear decrease AD 1400 to 2000, pointing towards zero around AD 2030. As this would correspond to an infinite population, it cannot really happen.
This linear decrease corresponds to a growth form where the doubling time required for each doubling of the population is half of that for the previous doubling.
A mathematical model leading to this form of growth is one in which the relative growth is proportional to the population. This can be contrasted with exponential growth, where the absolute growth is proportional to population, i.e., where the relative growth is constant.
Licensing edit
| I, the copyright holder of this work, release this work into the public domain. This applies worldwide. In some countries this may not be legally possible; if so: I grant anyone the right to use this work for any purpose, without any conditions, unless such conditions are required by law. |
File history
Click on a date/time to view the file as it appeared at that time.
| Date/Time | Thumbnail | Dimensions | User | Comment | |
|---|---|---|---|---|---|
| current | 22:06, 2 October 2016 | | 2,674 × 1,912 (32 KB) | Cmdrjameson (talk | contribs) | Compressed with pngout. Reduced by 98kB (75% decrease). |
| 09:36, 9 June 2006 |  | 2,674 × 1,912 (130 KB) | Noe (talk | contribs) | ||
| 09:28, 9 June 2006 |  | 2,982 × 2,197 (151 KB) | Noe (talk | contribs) | ||
| 09:16, 9 June 2006 |  | 3,508 × 2,480 (179 KB) | Noe (talk | contribs) | ||
| 12:46, 22 September 2005 |  | 1,755 × 1,316 (121 KB) | Noe (talk | contribs) | Graph of one over estimated human population of the World, from year 501 BC to 2050 AD. Shows development in available land area, or in any other constant resource, per capita. Note the almost linear decrease over the last 500 years, pointing towards ze | |
| 12:41, 22 September 2005 |  | 2,339 × 1,654 (152 KB) | Noe (talk | contribs) | Graph of one over estimated human population of the World, from year 501 BC to 2050 AD. Shows development in available land area, or in any other constant resource, per capita. Note the almost linear decrease over the last 500 years, pointing towards ze |
You cannot overwrite this file.
File usage on Commons
There are no pages that use this file.
File usage on other wikis
The following other wikis use this file:
- Usage on en.wikipedia.org