File:Revenue of Japan Government.svg

Size of this PNG preview of this SVG file: 800 × 400 pixels. Other resolutions: 320 × 160 pixels | 640 × 320 pixels | 1,024 × 512 pixels | 1,280 × 640 pixels | 2,560 × 1,280 pixels | 900 × 450 pixels.
Original file (SVG file, nominally 900 × 450 pixels, file size: 134 KB)
Captions
Captions
Revenue of Japan Government

|
This file may be updated to reflect new information. If you wish to use a specific version of the file without new updates being mirrored, please upload the required version as a separate file. |
Summary
edit
| Description |
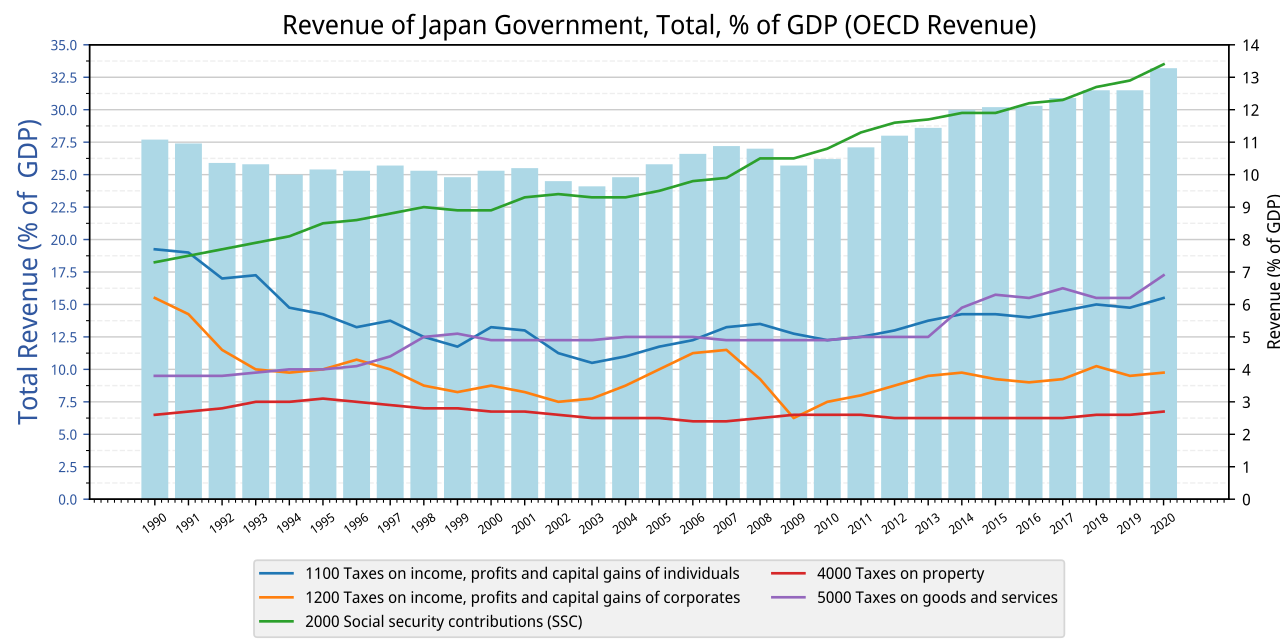
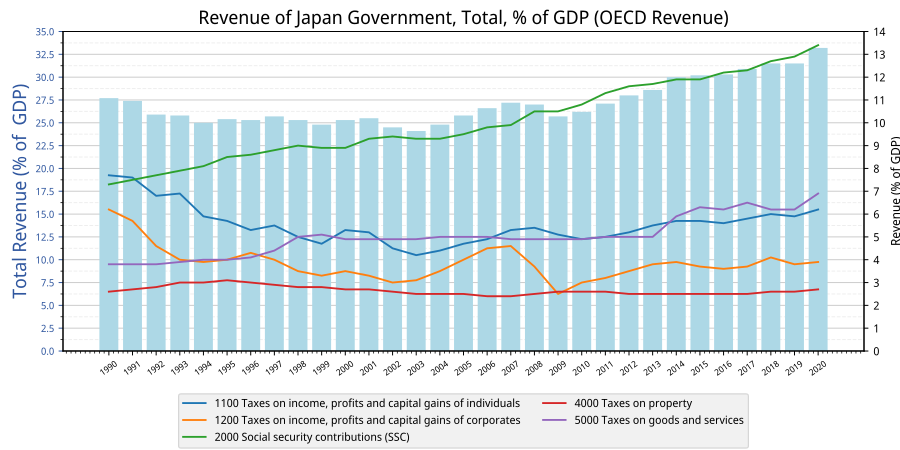
English: Revenue of Japan Government, Total, % of GDP |
| Date | |
| Source |
Own work, Data from OECD. https://stats.oecd.org/Index.aspx?DataSetCode=RS_GBL |
| Author | Yuasan |
| Permission (Reusing this file) |
CC-0 |
Graph data
edit
import matplotlib.pyplot as plt
from cycler import cycler
import pandas as pd
import matplotlib.ticker as ticker

df = pd.read_csv("data.tsv", index_col=0 , sep = "\t")
df1 = df.filter(like='00',axis=0).T
df2 = df.loc['Total tax revenue'].T


fig, ax = plt.subplots(figsize=(10, 5))
ax2 = ax.twinx()
plt.rcParams['font.family'] = 'sans-serif'
plt.rcParams['font.sans-serif'] = ['Noto Sans Display']
plt.subplots_adjust(left=0.07, bottom=0.22, right=0.96, top=0.93)
plt.setp(ax.get_xticklabels(), fontsize=7)
plt.setp(ax.get_yticklabels(), fontsize=8)


ax.bar(df2.index, df.loc['Total tax revenue'].T, color="lightblue")
ax.set_ylim([0,35])
ax.set_axisbelow(True)
ax.tick_params(axis='x', labelrotation=35)
ax.set_ylabel("Total Revenue (% of  GDP)", fontsize=15, color="#30579f")
ax.tick_params(axis='y', colors='#30579f')

ax2.set_prop_cycle( plt.rcParams['axes.prop_cycle'] )
ax2.plot(df1)
ax2.set_ylim([0,14])
ax2.legend(df1.columns, fontsize=9, ncol=2, loc='center' ,bbox_to_anchor=(0., -0.27, 1., 0.102) ,facecolor="#eeeeee" )
ax2.set_ylabel("Revenue (% of GDP)", fontsize=10)


plt.title("Revenue of Japan Government, Total, % of GDP (OECD Revenue)", fontsize=15)
plt.tick_params(labelsize=9, pad=4)
plt.grid(which='major',color='#cccccc',linestyle='-', axis="y")

ax.minorticks_on()
ax.yaxis.set_major_locator(ticker.MultipleLocator(2.5))
ax.yaxis.set_minor_locator(ticker.MultipleLocator(1.25))
ax.grid(False, which='minor', axis="x")
ax.grid(True, which='major',color='#cccccc',linestyle='-', axis="y")
ax.grid(True, which='minor',color='#eeeeee',linestyle='--', axis="y")
ax2.yaxis.set_major_locator(ticker.MultipleLocator(1))
ax2.grid(False, which='both', axis="both")

plt.savefig("image.svg")
Licensing
edit
I, the copyright holder of this work, hereby publish it under the following license:
| This file is made available under the Creative Commons CC0 1.0 Universal Public Domain Dedication. | |
| The person who associated a work with this deed has dedicated the work to the public domain by waiving all of their rights to the work worldwide under copyright law, including all related and neighboring rights, to the extent allowed by law. You can copy, modify, distribute and perform the work, even for commercial purposes, all without asking permission.
|
File history
Click on a date/time to view the file as it appeared at that time.
| Date/Time | Thumbnail | Dimensions | User | Comment | |
|---|---|---|---|---|---|
| current | 11:14, 8 July 2023 | | 900 × 450 (134 KB) | Yuasan (talk | contribs) | 2020 data |
| 13:13, 18 October 2021 |  | 1,080 × 720 (94 KB) | Yuasan (talk | contribs) | Uploaded own work with UploadWizard |
You cannot overwrite this file.
File usage on Commons
There are no pages that use this file.
File usage on other wikis
The following other wikis use this file: