File:Sine Cosine Graph.svg

Size of this PNG preview of this SVG file: 512 × 341 pixels. Other resolutions: 320 × 213 pixels | 640 × 426 pixels | 1,024 × 682 pixels | 1,280 × 853 pixels | 2,560 × 1,705 pixels.
Original file (SVG file, nominally 512 × 341 pixels, file size: 14 KB)
Captions
Captions
Add a one-line explanation of what this file represents
Summary edit
| Description |
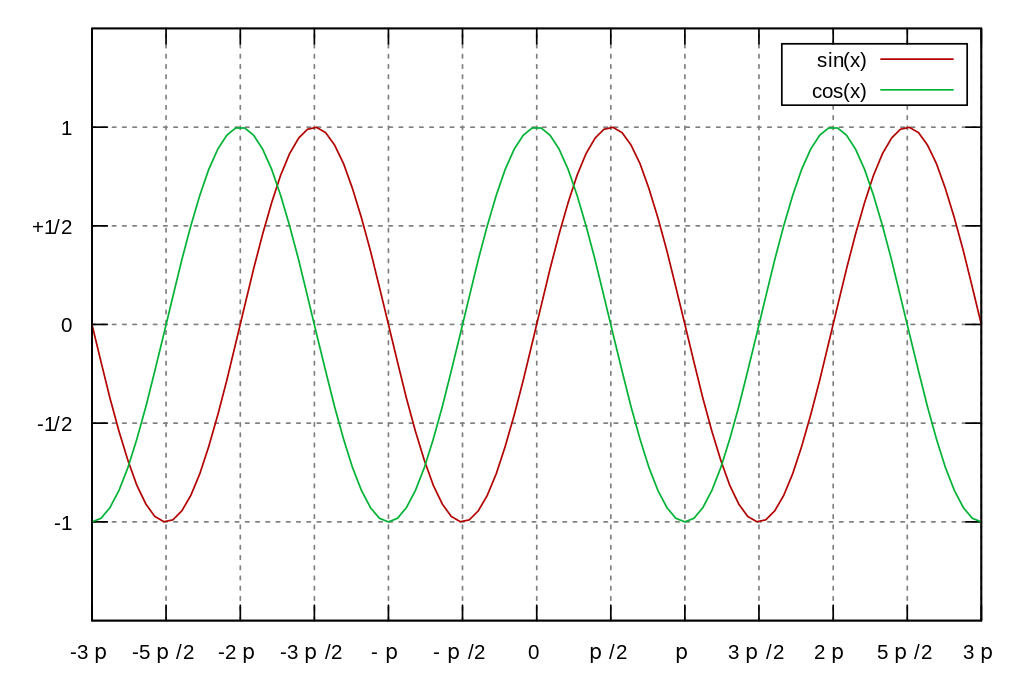
English: The Graphs of Sine and Cosine.
Русский: Графики тригонометрических функций y(x) = sin(x) и y(x) = cos(x). |
| Date | |
| Source | Own work |
| Author | Dmitry Nosachev |
Licensing edit
I, the copyright holder of this work, hereby publish it under the following license:
This file is licensed under the Creative Commons Attribution-Share Alike 4.0 International license.
- You are free:
- to share – to copy, distribute and transmit the work
- to remix – to adapt the work
- Under the following conditions:
- attribution – You must give appropriate credit, provide a link to the license, and indicate if changes were made. You may do so in any reasonable manner, but not in any way that suggests the licensor endorses you or your use.
- share alike – If you remix, transform, or build upon the material, you must distribute your contributions under the same or compatible license as the original.
This plot was created with Gnuplot.
gnuplot source edit
set terminal svg size 600, 400 dynamic enhanced fname 'Liberation Sans, Sans' fsize '12' rounded dashed background rgb 'white'
set output 'Sine_Cosine_Graph.svg'

set linetype 1 lw 1 lc rgb "#B20000"
set linetype 2 lw 1 lc rgb "#00B233"
set linetype 3 lw 1 lc rgb "#0000B2"
set linetype 4 lw 1 lc rgb "#B29200"
set linetype 5 lw 1 lc rgb "#8400B2"
set linetype 6 lw 1 lc rgb "#79B200"
set linetype 7 lw 1 lc rgb "#00B2B2"

set style line 11 lc rgb '#808080' lt 1

set style line 12 lc rgb '#808080' lt 0 lw 1
set key inside right top vertical Right noreverse enhanced autotitle box lt black linewidth 1.000 dashtype solid
set grid back ls 12

set xtics ('-3{/Symbol p}' -3*pi, '{-5{/Symbol p}/2}' -5*pi/2, '-2{/Symbol p}' -2*pi, '{-3{/Symbol p}/2}' -3*pi/2, '{-{/Symbol p}}' -pi, '{-{/Symbol p}/2}' -pi*0.5, 0, '{{/Symbol p}/2}' pi*0.5, '{/Symbol p}' pi, '{3{/Symbol p}/2}' 3*pi/2, '2{/Symbol p}' 2*pi, '{5{/Symbol p}/2}' 5*pi/2, '3{/Symbol p}' 3*pi)
set ytics (-1, '{-1/2}' -0.5, 0, '{+1/2}' 0.5, 1)

set xrange [-3*pi:3*pi]
set yrange [-1.5:1.5]

plot sin(x), cos(x)
File history
Click on a date/time to view the file as it appeared at that time.
| Date/Time | Thumbnail | Dimensions | User | Comment | |
|---|---|---|---|---|---|
| current | 11:07, 18 February 2016 | | 512 × 341 (14 KB) | Nosachevd (talk | contribs) | User created page with UploadWizard |
You cannot overwrite this file.
File usage on Commons
The following page uses this file:
File usage on other wikis
The following other wikis use this file:
- Usage on cv.wikipedia.org
- Usage on mdf.wikipedia.org
- Usage on ru.wikipedia.org
- Usage on uk.wikipedia.org