File:Single-cell RNA sequencing of freshly isolated TEC defines common cell clusters to mTEC and cTEC that are maintained in vitro.webp
Size of this PNG preview of this WEBP file: 523 × 600 pixels. Other resolutions: 209 × 240 pixels | 419 × 480 pixels | 670 × 768 pixels | 893 × 1,024 pixels | 2,011 × 2,306 pixels.
Original file (2,011 × 2,306 pixels, file size: 280 KB, MIME type: image/webp)
Captions
Captions
From the study "Reconstitution of a functional human thymus by postnatal stromal progenitor cells and natural whole-organ scaffolds"
Summary
edit
| Description |
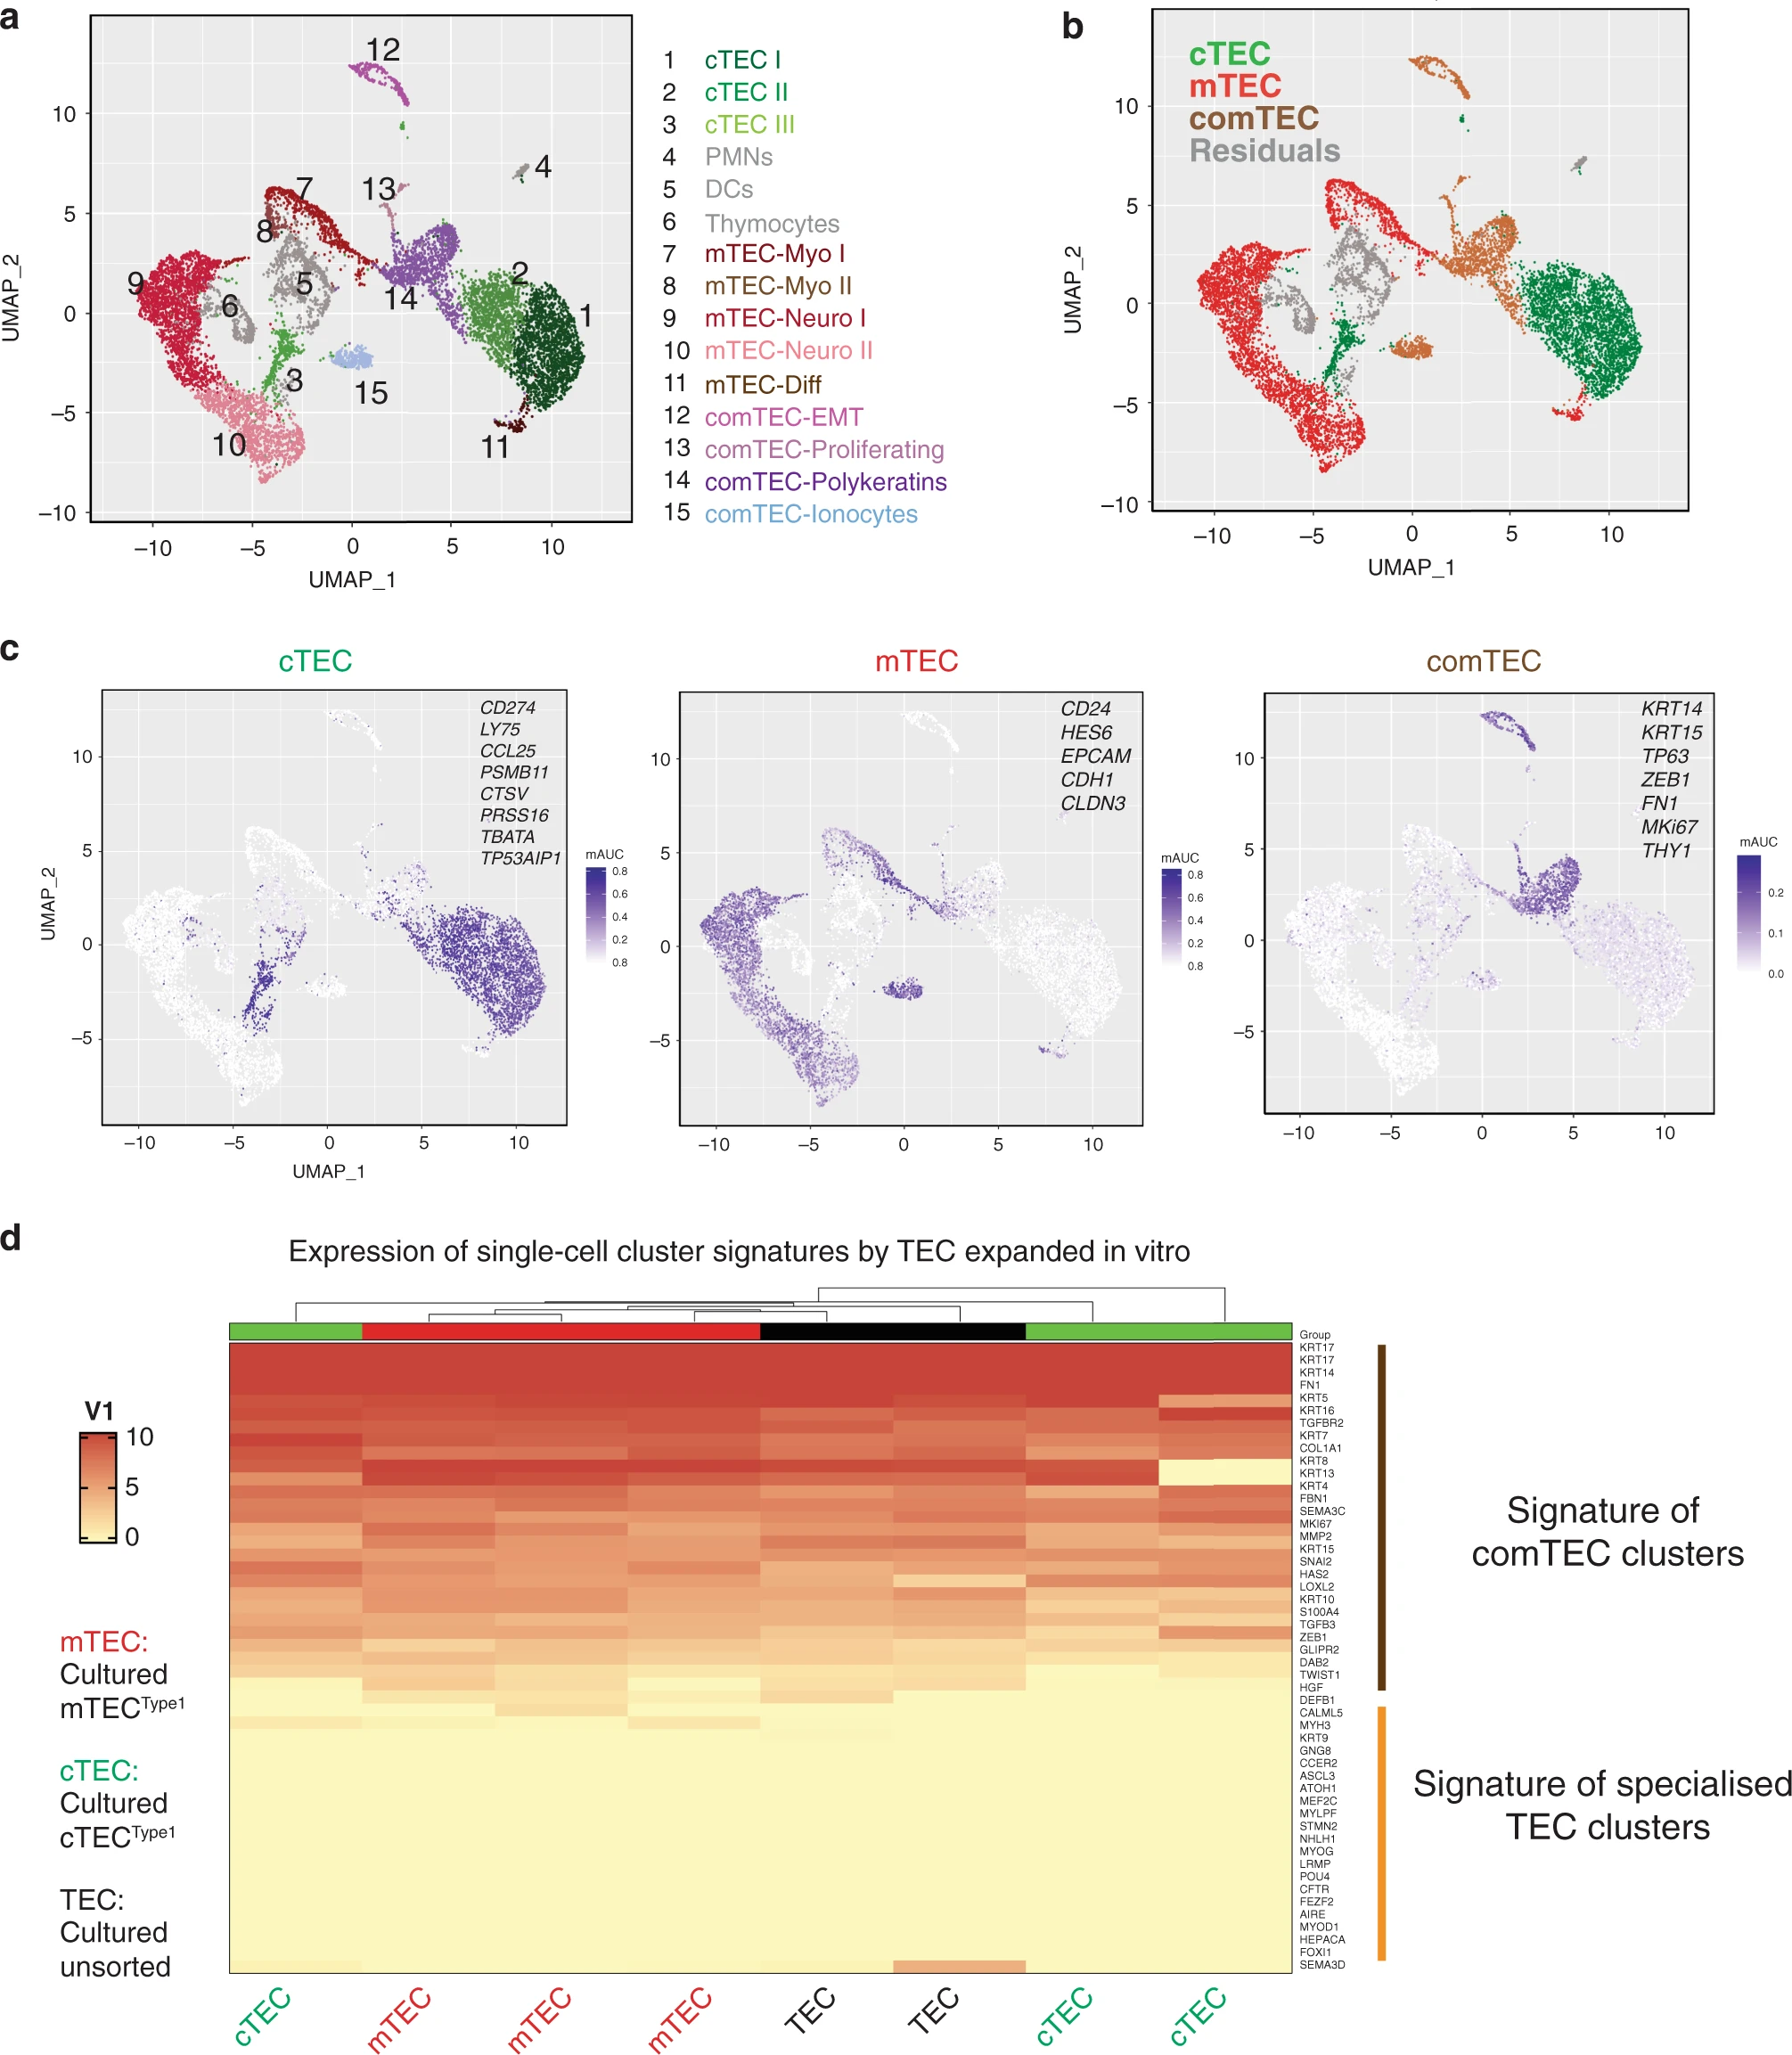
English: "a UMAP visualisation of the cellular composition of the human post-natal thymus by clusters indicated by colours and numbers from 1 to 15 describing the heterogeneity of cTEC (1–3) and mTEC (7-11). Clusters 12–15 were common to cortex and medulla (comTEC); clusters 4–6 described residual immune cells (PMNs, DCs and thymocytes). b UMAP representation of the same thymic cells indicating main subgroups (cTEC, cortical epithelial cells, in green; mTEC, medullary epithelial cells, in red; TEC cells with common features, in brown and residuals of immune cells in grey). c Area under the curve (AUC) summary intensity plots for the gene signatures of cTEC (CCL25, CD274, CFC1, CTSV, FOXN1, KCNIP3, LY75, PRSS16, PSMB11, SCX, SLC46A2, TBATA and TP53AIP1), mTEC (CD24, CDH1, CLDN3, EPCAM and HES6) and comTEC (CCL19, CFTR, COL1A1, DAB2, FN1, GLIPR2, HAS2, HGF, KRT14, KRT15, LOXL2, MKI67, MMP2, S100A4, SNAI1, SNAI2, TFCP2L1, TGFB3, TGFBR2, THY1, TP63, TWIST1 and ZEB1) clusters showing expression level for lineage specific genes in a purple scale. Single-cell expression values are represented as calculated median intensity of area under the curve. d Heatmap and hierarchical clustering of cultured cTECType1 (green, n = 3), mTECType1 (red, n = 3) and cultured unsorted TEC (black, n = 2) according to main genes clusters defined in single-cell RNA sequencing. Genes list is displayed on the right and includes comTEC signatures (epithelial-to-mesenchymal transition (EMT), polykeratins and proliferative - clusters 12-13-14) and specialised cell clusters: Myo (clusters 7-8), Neuro (clusters 9–10), Ionocytes (cluster 15) and differentiated mTEC (cluster 11)." |
| Date | |
| Source | https://www.nature.com/articles/s41467-020-20082-7 |
| Author | Authors of the study: Sara Campinoti, Asllan Gjinovci, Roberta Ragazzini, Luca Zanieri, Linda Ariza-McNaughton, Marco Catucci, Stefan Boeing, Jong-Eun Park, John C. Hutchinson, Miguel Muñoz-Ruiz, Pierluigi G. Manti, Gianluca Vozza, Carlo E. Villa, Demetra-Ellie Phylactopoulos, Constance Maurer, Giuseppe Testa, Hans J. Stauss, Sarah A. Teichmann, Neil J. Sebire, Adrian C. Hayday, Dominique Bonnet & Paola Bonfanti |
Licensing
edit
This file is licensed under the Creative Commons Attribution 4.0 International license.
- You are free:
- to share – to copy, distribute and transmit the work
- to remix – to adapt the work
- Under the following conditions:
- attribution – You must give appropriate credit, provide a link to the license, and indicate if changes were made. You may do so in any reasonable manner, but not in any way that suggests the licensor endorses you or your use.
File history
Click on a date/time to view the file as it appeared at that time.
| Date/Time | Thumbnail | Dimensions | User | Comment | |
|---|---|---|---|---|---|
| current | 15:28, 28 January 2021 | | 2,011 × 2,306 (280 KB) | Prototyperspective (talk | contribs) | Uploaded a work by Authors of the study: Sara Campinoti, Asllan Gjinovci, Roberta Ragazzini, Luca Zanieri, Linda Ariza-McNaughton, Marco Catucci, Stefan Boeing, Jong-Eun Park, John C. Hutchinson, Miguel Muñoz-Ruiz, Pierluigi G. Manti, Gianluca Vozza, Carlo E. Villa, Demetra-Ellie Phylactopoulos, Constance Maurer, Giuseppe Testa, Hans J. Stauss, Sarah A. Teichmann, Neil J. Sebire, Adrian C. Hayday, Dominique Bonnet & Paola Bonfanti from https://www.nature.com/articles/s41467-020-20082-7 with U... |
You cannot overwrite this file.
File usage on Commons
There are no pages that use this file.