File:Slow Reveal Graphs- Global Mean Sea Level 1993-2023 (SVS5312 - seaLevelRise Slow 4 00418 print).jpg

Size of this preview: 800 × 450 pixels. Other resolutions: 320 × 180 pixels | 640 × 360 pixels | 1,024 × 576 pixels.
Original file (1,024 × 576 pixels, file size: 180 KB, MIME type: image/jpeg)
Captions
Captions
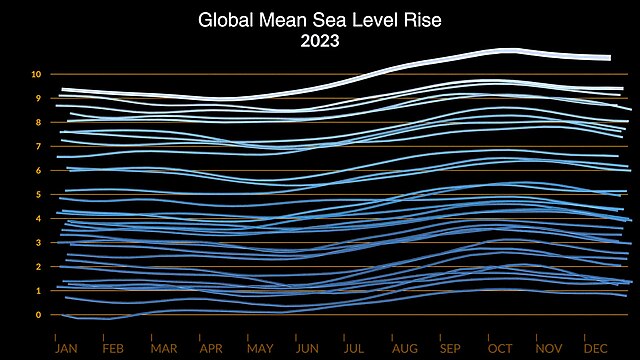
Step 4: Title & Line CountPlay the video for the class. “What’s new now?”They should notice the numbers on the vertical axis, along with the title of the graph.
Summary
edit| Description |
English: Step 4: Title & Line CountPlay the video for the class. “What’s new now?”They should notice the numbers on the vertical axis, along with the title of the graph.Based on the title, what do these numbers on the vertical axis represent?What’s a reasonable unit? Review units that measure length, if necessary! |
| Date | 16 June 2024 (upload date) |
| Source | Slow Reveal Graphs: Global Mean Sea Level 1993-2023 |
| Author | NASA's Scientific Visualization Studio - NASA/GSFC/Mark SubbaRao, NASA/JPL/Benjamin Hamlington, Maryland State Department of Education/Stacie Marvin |
| Other versions |
|
| Keywords | Earth Science; Oceans; Sea Level Rise; Physical oceanography; Coastal Processes; Sea Level |
.jpg)
.jpg)
.jpg)
.jpg)
.png)
.jpg&action=edit§ion=1)
Licensing
edit.jpg&action=edit§ion=2)
| This file is in the public domain in the United States because it was solely created by NASA. NASA copyright policy states that "NASA material is not protected by copyright unless noted". (See Template:PD-USGov, NASA copyright policy page or JPL Image Use Policy.) | ||
 |
Warnings:
|
File history
Click on a date/time to view the file as it appeared at that time.
| Date/Time | Thumbnail | Dimensions | User | Comment | |
|---|---|---|---|---|---|
| current | 03:04, 23 June 2024 | | 1,024 × 576 (180 KB) | OptimusPrimeBot (talk | contribs) | #Spacemedia - Upload of https://svs.gsfc.nasa.gov/vis/a000000/a005300/a005312/seaLevelRise_Slow_4.00418_print.jpg via Commons:Spacemedia |
You cannot overwrite this file.
File usage on Commons
The following 10 pages use this file:
- File:Slow Reveal Graphs- Global Mean Sea Level 1993-2023 (SVS5312).png
- File:Slow Reveal Graphs- Global Mean Sea Level 1993-2023 (SVS5312 - seaLevelRise Slow 1).webm
- File:Slow Reveal Graphs- Global Mean Sea Level 1993-2023 (SVS5312 - seaLevelRise Slow 1 00410 print).jpg
- File:Slow Reveal Graphs- Global Mean Sea Level 1993-2023 (SVS5312 - seaLevelRise Slow 2).webm
- File:Slow Reveal Graphs- Global Mean Sea Level 1993-2023 (SVS5312 - seaLevelRise Slow 2 print).jpg
- File:Slow Reveal Graphs- Global Mean Sea Level 1993-2023 (SVS5312 - seaLevelRise Slow 3).webm
- File:Slow Reveal Graphs- Global Mean Sea Level 1993-2023 (SVS5312 - seaLevelRise Slow 3 00418 print).jpg
- File:Slow Reveal Graphs- Global Mean Sea Level 1993-2023 (SVS5312 - seaLevelRise Slow 4).webm
- File:Slow Reveal Graphs- Global Mean Sea Level 1993-2023 (SVS5312 - seaLevelRise Slow 5).webm
- File:Slow Reveal Graphs- Global Mean Sea Level 1993-2023 (SVS5312 - seaLevelRise Slow 5 00418 print).jpg
.jpg&oldid=887058155)