File:Solpath.svg

Size of this PNG preview of this SVG file: 662 × 331 pixels. Other resolutions: 320 × 160 pixels | 640 × 320 pixels | 1,024 × 512 pixels | 1,280 × 640 pixels | 2,560 × 1,280 pixels.
Original file (SVG file, nominally 662 × 331 pixels, file size: 601 KB)
Captions
Captions
Add a one-line explanation of what this file represents
Summary
edit
| Description |
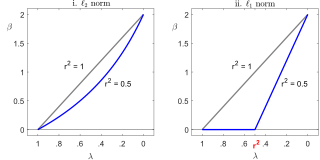
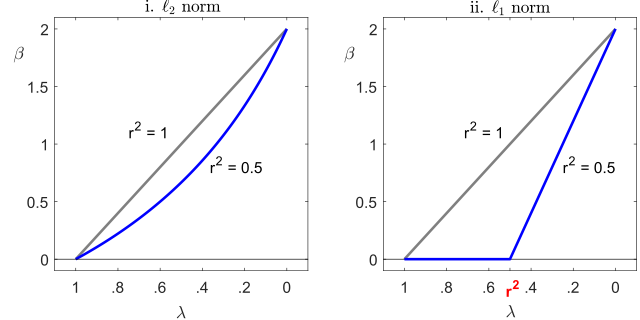
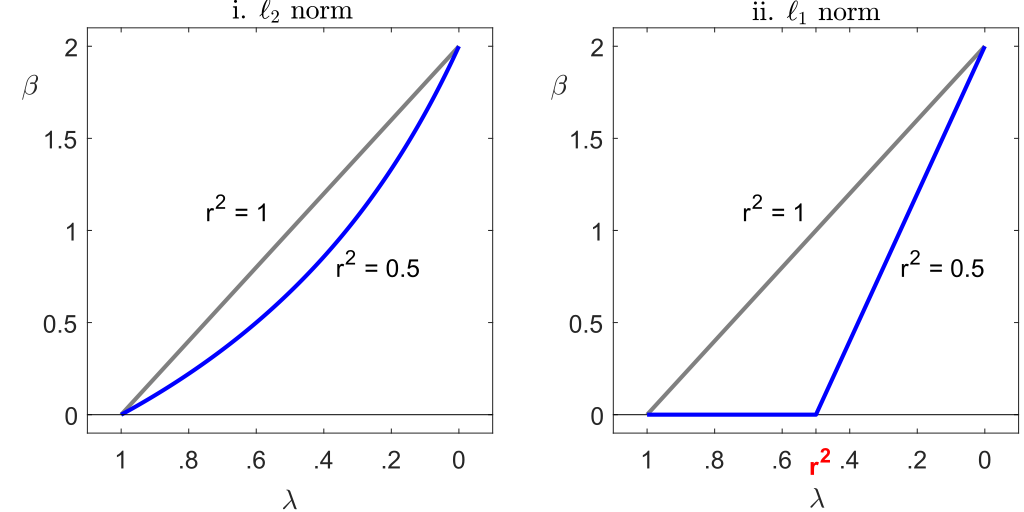
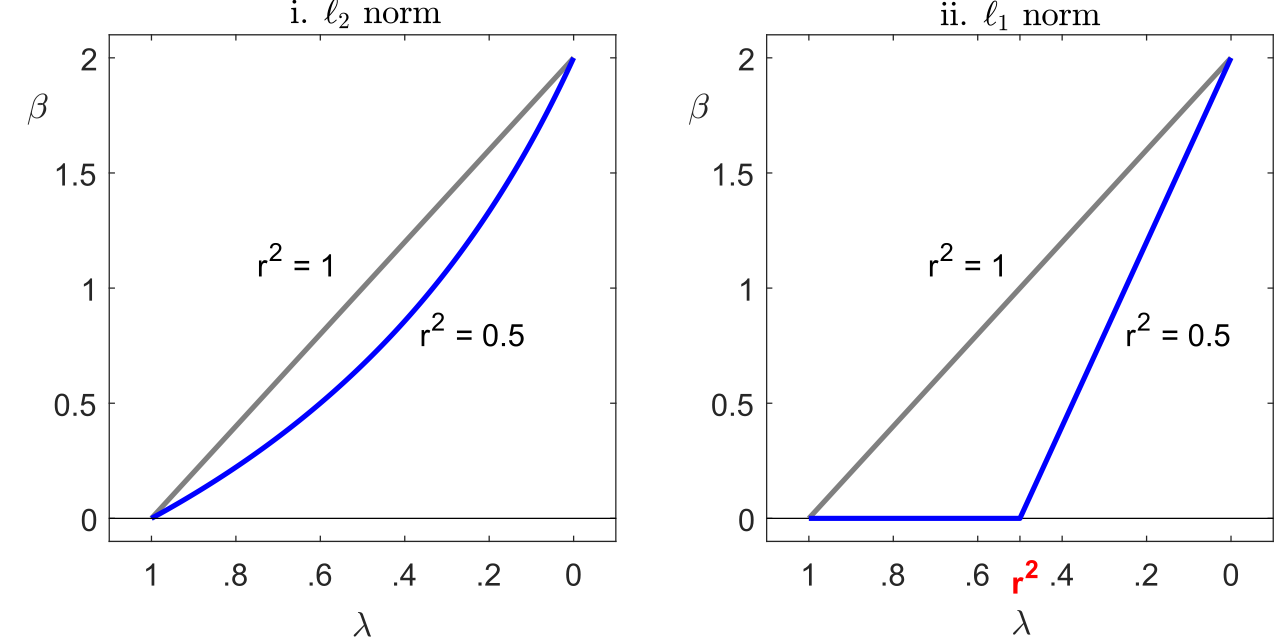
English: This figure presents solution paths when there is a single regressor and when the data-optimized OLS parameter equals 2. The r-squared measure of fit is either 0.5 or 1. In the left panel, an L2 norm is used to penalize deviations from 0 and, in the right panel, an L1 norm is used. For lambda values close to zero, both plots move in the direction of the point (r-squared, 0). For the L2 norm, the effect of r-squared diminishes as lambda increases. |
| Date | |
| Source | Own work |
| Author | Beos123 |
Licensing
edit
I, the copyright holder of this work, hereby publish it under the following license:
This file is licensed under the Creative Commons Attribution-Share Alike 4.0 International license.
- You are free:
- to share – to copy, distribute and transmit the work
- to remix – to adapt the work
- Under the following conditions:
- attribution – You must give appropriate credit, provide a link to the license, and indicate if changes were made. You may do so in any reasonable manner, but not in any way that suggests the licensor endorses you or your use.
- share alike – If you remix, transform, or build upon the material, you must distribute your contributions under the same or compatible license as the original.

|
This media file is uncategorized.
Please help improve this media file by adding it to one or more categories, so it may be associated with related media files (how?), and so that it can be more easily found.
Please notify the uploader with {{subst:Please link images|File:Solpath.svg}} ~~~~ |
File history
Click on a date/time to view the file as it appeared at that time.
| Date/Time | Thumbnail | Dimensions | User | Comment | |
|---|---|---|---|---|---|
| current | 22:24, 7 January 2019 | | 662 × 331 (601 KB) | Beos123 (talk | contribs) | Cross-wiki upload from en.wikipedia.org |
You cannot overwrite this file.
File usage on Commons
There are no pages that use this file.