File:Spectral class surface temperature relation main sequence 1.svg

Original file (SVG file, nominally 1,131 × 711 pixels, file size: 36 KB)
Captions
Captions
Summary
edit
| Description |
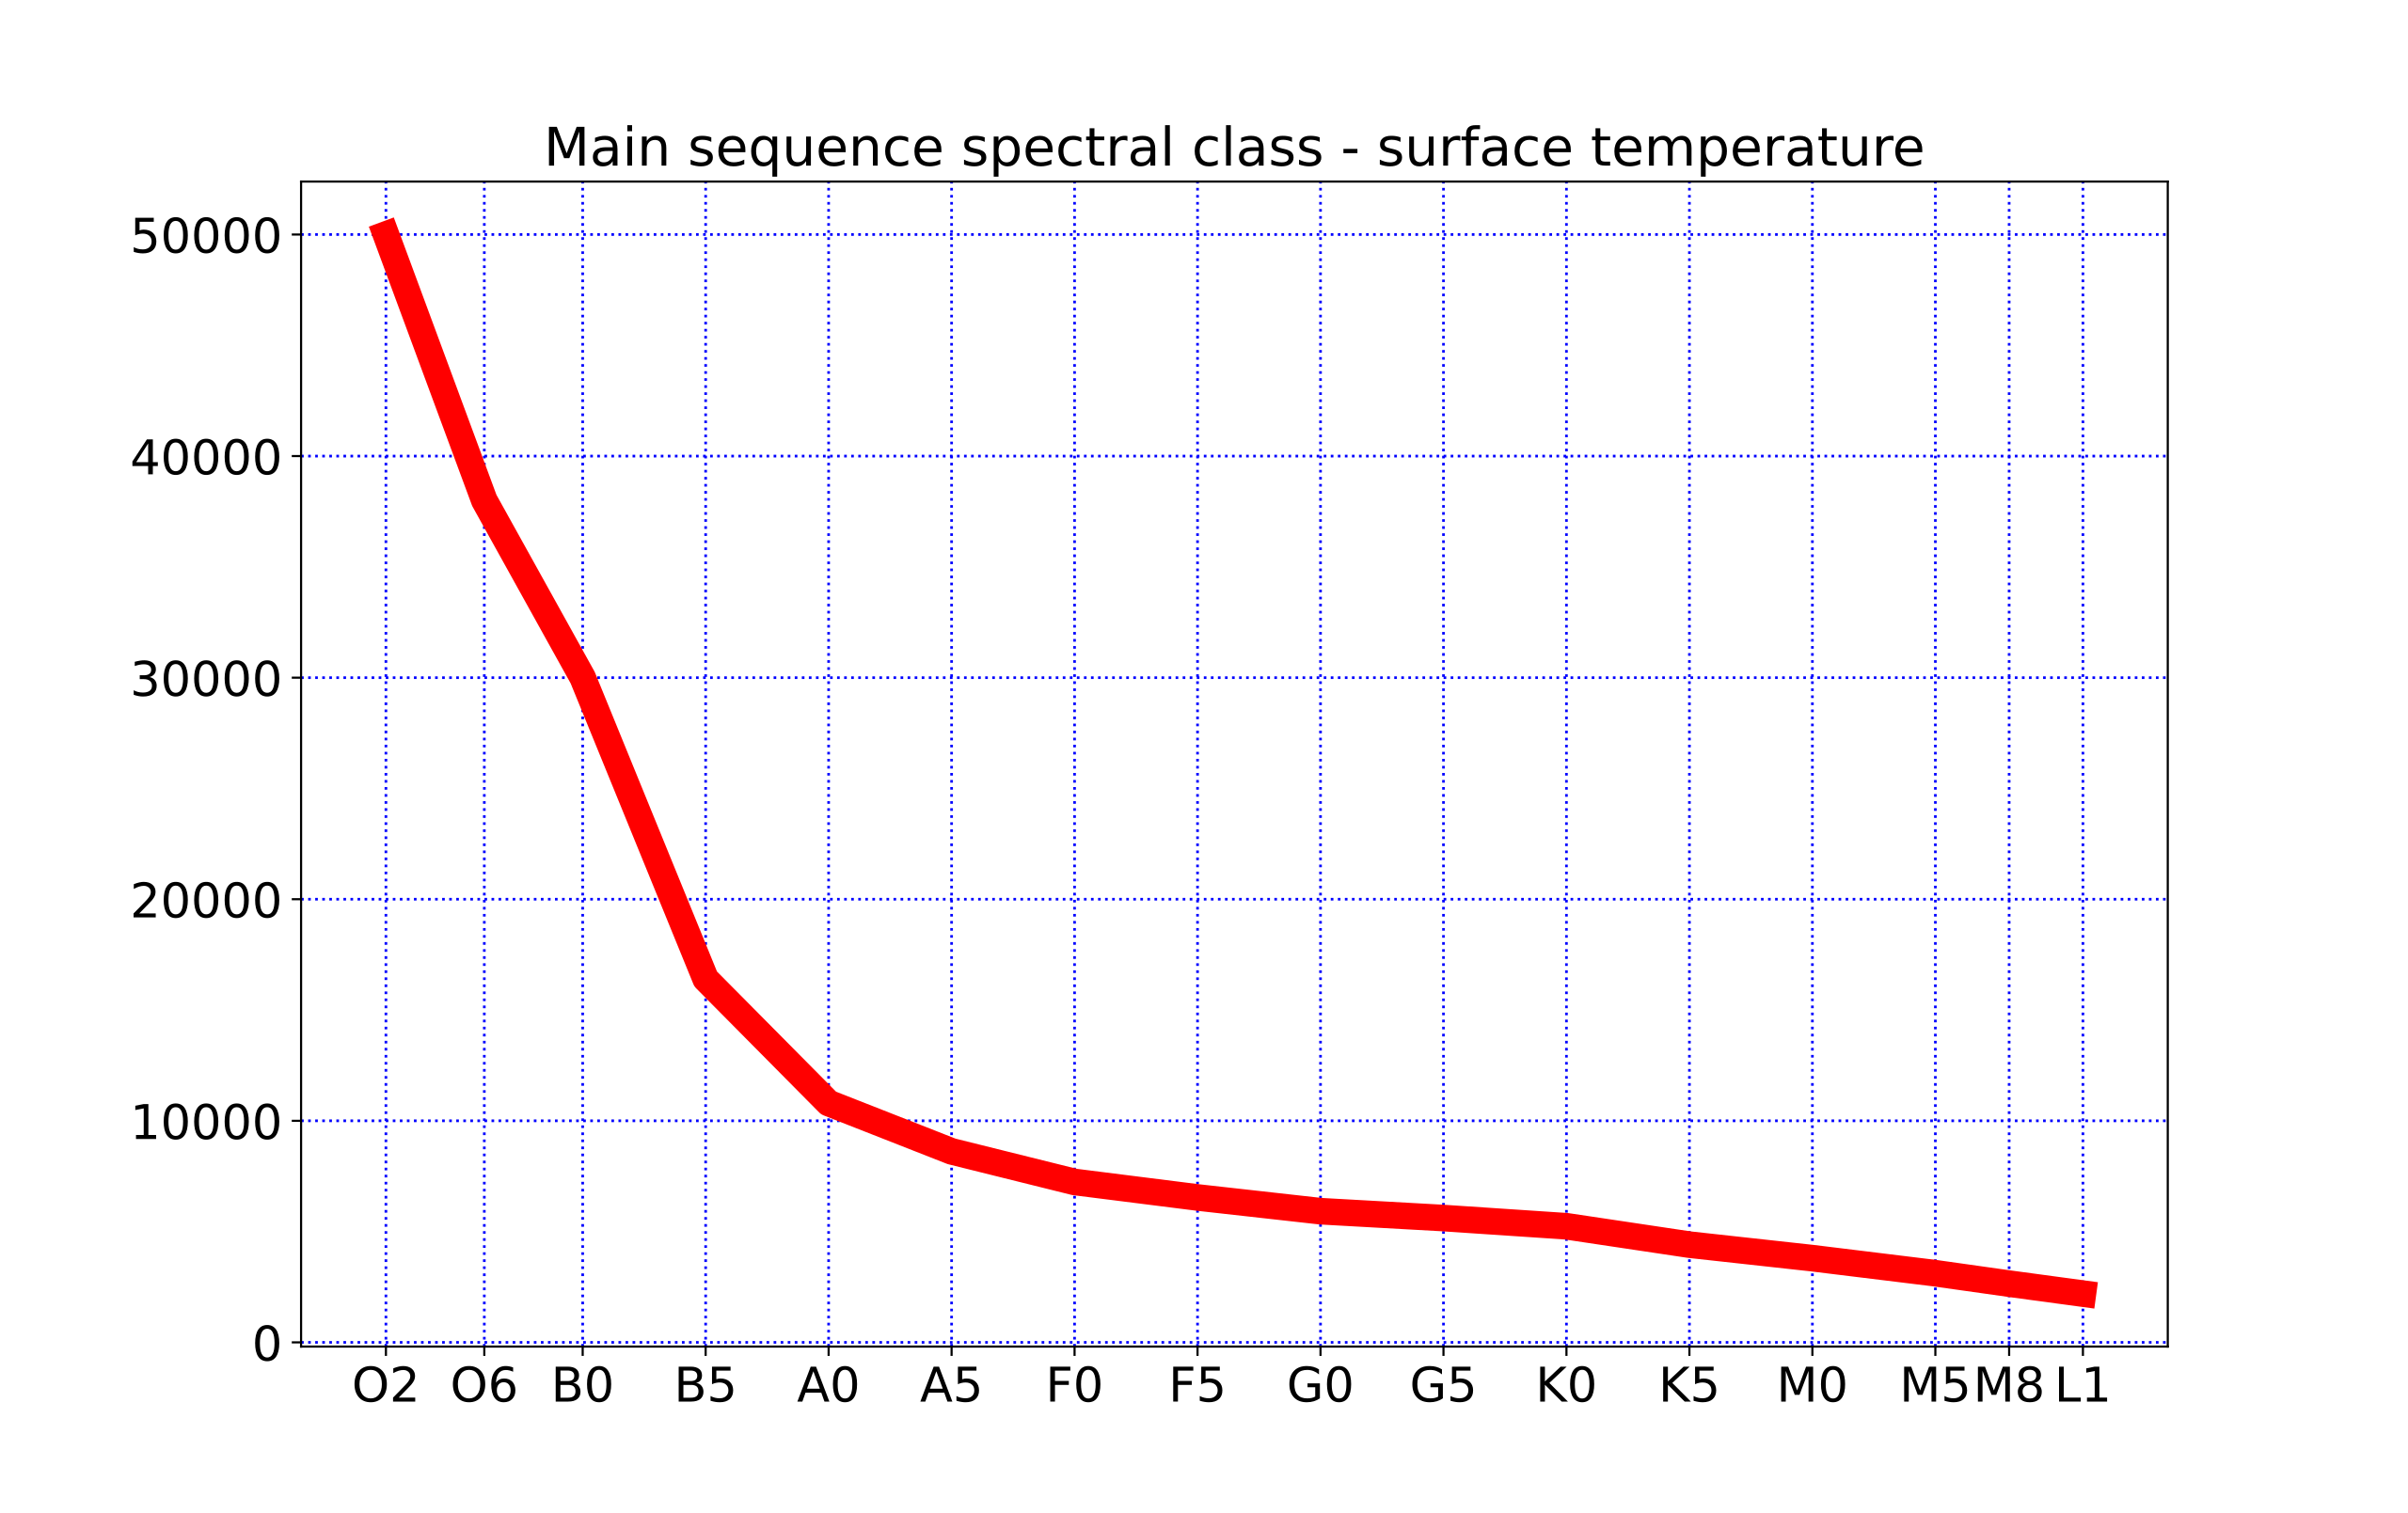
English: Spectral class - surface temperature relation of main sequence star |
| Date | |
| Source | Own work |
| Author | Merikanto |
Source of stellar data is wikipedia article "main sequence" in 2023
Steller data
spectral,radius, mass, luminosity,teff
"O2",12,100,800000,50000
"O6",9.8,35,180000,38000
"B0",7.4,18,20000,30000
"B5",3.8,6.5,800,16400
"A0",2.5,3.2,80,10800
"A5",1.7,2.1,20,8620
"F0",1.3,1.7,6,7240
"F5",1.2,1.3,2.5,6540
"G0",1.05,1.10,1.26,5920
"G5",0.93,0.93,0.79,5610
"K0",0.85,0.78,0.40,5240
"K5",0.74,0.69,0.16,4410
"M0",0.51,0.60,0.072,3800
"M5",0.18,0.15,0.0027,3120
"M8",0.11,0.08,0.0004,2650
"L1",0.09,0.07,0.00017,2200
Python code to interpolate and view data
-
- star spectral type and temperature interpolator
- needs predefined table of staller tspectral types, masses, temperatures ...
- python 3 code
-
- 13.2.2023 v 0000.0000
import numpy as np
- import scipy as sp
import matplotlib.pyplot as plt
import math
import pandas as pd
from sklearn import metrics
from sklearn.linear_model import LinearRegression
from sklearn.ensemble import RandomForestRegressor
from sklearn.metrics import r2_score
from pygam import GAM, s, te
from pygam import LinearGAM
from pygam import PoissonGAM
- from pygam import LogisticGAM
from scipy import interpolate
def linear_log_predict1(x,y):
	logx=np.log10(x).reshape(-1, 1)
	logy=np.log10(y).reshape(-1, 1)
	logmodel= LinearRegression().fit(logx, logy)
	logk=logmodel.coef_
	logb=logmodel.intercept_
	#print(logmodel)
	logpre=logmodel.predict(logx)
	pre=np.power(10, logpre)
	return(pre, logk, logb)


def linear_log_predict2(x,y, x2):
	logx=np.log10(x).reshape(-1, 1)
	logy=np.log10(y).reshape(-1, 1)
	logx2=np.log10(x2).reshape(-1, 1)
	logmodel= LinearRegression().fit(logx, logy)
	logk=logmodel.coef_
	logb=logmodel.intercept_
	#print(loglums_model)
	logpre=logmodel.predict(logx2)
	pre=np.power(10, logpre)
	return(pre)
def linear_log_predict_point(x,y, px):
	logx=np.log10(x).reshape(-1, 1)
	logy=np.log10(y).reshape(-1, 1)
	logmodel= LinearRegression().fit(logx, logy)
	logk=logmodel.coef_
	logb=logmodel.intercept_
	logpx=math.log10(px)
	logpy=logb+logpx*logk
	py=math.pow(10,logpy)
	return(py)
def gamma_log_predict2(x,y, x2):
	logx=np.log10(x).reshape(-1, 1)
	logy=np.log10(y).reshape(-1, 1)
	logx2=np.log10(x2).reshape(-1, 1)
	gam = LinearGAM(s(0, n_splines=10)).fit(logx,logy)
	#gam = PoissonGAM(s(0, n_splines=10)).fit(logx,logy)
	logpre = gam.predict(logx2)
	pre=np.power(10, logpre)
	return(pre)
def gamma_predict3(x,y, x2):
	ex=x.reshape(-1, 1)
	ey=y.reshape(-1, 1)
	ex2=x2.reshape(-1, 1)
	gam = LogisticGAM(s(0, n_splines=10)).fit(ex,ey)
	pre = gam.predict(ex2)
	return(pre)
def rf_log_predict2(x,y, x2):
	logx=np.log10(x).reshape(-1, 1)
	logy=np.log10(y).reshape(-1, 1)
	logx2=np.log10(x2).reshape(-1, 1)
	regressor = RandomForestRegressor(n_estimators=10000, random_state=0)
	regressor.fit(logx,logy)
	logpre = regressor.predict(logx2)
	pre=np.power(10, logpre)
	return(pre)
def interpolate1(x,y, x2):
	f = interpolate.interp1d(x, y)
	y2 = f(x2)
	return(y2)
def interpolate_point(x,y, px):
	f = interpolate.interp1d(x, y)
	y2 = f(px)
	return(y2)


def interpolate2(x,y, x2):
	logx=np.log10(x).reshape(-1, 1)
	logy=np.log10(y).reshape(-1, 1)
	logx2=np.log10(x2).reshape(-1, 1)
	f = interpolate.interp1d(logx, logy)
	y2 = f(logx2)
	pre=np.power(10,y2)
	return(y2)
def speknum(spt):
	spe=spt
	spe=spe.replace('O', '1')
	spe=spe.replace('B', '2')
	spe=spe.replace('A', '3')
	spe=spe.replace('F', '4')
	spe=spe.replace('G', '5')
	spe=spe.replace('K', '6')
	spe=spe.replace('M', '7')
	spe=spe.replace('L', '8')
	return(int(spe))
- load main sequence star data, edited from wiki 2023
- https://en.wikipedia.org/wiki/Main_sequence
arrname1="mainseq1.txt"
starr1 = np.loadtxt(arrname1,skiprows=1,dtype="float",delimiter=",",usecols =(1,2,3,4))
print(starr1)
masses1=starr1[:,1]
lums1=starr1[:,2]
temps1=starr1[:,3]
radiuses1=starr1[:,0]
print (masses1)
print (lums1)
print (temps1)
df00 = pd.read_csv(arrname1, sep=",")
- print(df00)
spek1=df00['spectral']
- print(spek1)
classes="OBAFGKML"
spek2=spek1.tolist()
- print(spek2)
spek3 = [sub.replace('O', '1') for sub in spek2]
spek3 = [sub.replace('B', '2') for sub in spek3]
spek3 = [sub.replace('A', '3') for sub in spek3]
spek3 = [sub.replace('F', '4') for sub in spek3]
spek3 = [sub.replace('G', '5') for sub in spek3]
spek3 = [sub.replace('K', '6') for sub in spek3]
spek3 = [sub.replace('M', '7') for sub in spek3]
spek3 = [sub.replace('L', '8') for sub in spek3]
- print(spek3)
spek4=np.array(spek3).astype(float)
- print(spek4)
speg1=np.arange(12,82,1)
- print(speg1)
speg2=speg1.astype(int)
- print(speg2)
speg3=speg2.tolist()
- print(speg3)
speg4 = [str(x) for x in speg3]
- print(speg4)
speg5=[]
first1=0
for sx in speg4:
	sy=sx
	print(sy)
	chari1=sy[0]
	if(sy[0]=='1'):
		sy=sy.replace(sy[0],"O",1)
	if(sy[0]=='2'):
		sy=sy.replace(sy[0],"B",1)
	if(sy[0]=='3'):
		sy=sy.replace(sy[0],"A",1)
	if(sy[0]=='4'):
		sy=sy.replace(sy[0],"F",1)
	if(sy[0]=='5'):
		sy=sy.replace(sy[0],"G",1)
	if(sy[0]=='6'):
		sy=sy.replace(sy[0],"K",1)
	if(sy[0]=='7'):
		sy=sy.replace(sy[0],"M",1)
	if(sy[0]=='8'):
		sy=sy.replace(sy[0],"L",1)
	speg5.append(sy)
- print("speg5")
- print(spek4)
- print(speg1)
- print(speg5)
spektr1=spek4
spektr2=speg1
sally1=spek2
sally2=speg5
print(sally1)
print(sally2)
print(spektr1)
print(spektr2)
masses2=interpolate1(spektr1, masses1, spektr2)
radiuses2=interpolate1(spektr1, radiuses1, spektr2)
lums2=interpolate1(spektr1, lums1, spektr2)
temps2=interpolate1(spektr1, temps1, spektr2)
spt1="G2"
spnum1=speknum(spt1)
teff1=interpolate_point(spektr1,temps1, spnum1)
print(spt1, spnum1,teff1)
- lum1=interpolate_point(masses1, lums1, m1)
- plt.xlim(0.1, 1.5)
- plt.ylim(0.0, 3)
font = {'family' : 'DejaVu Sans',
       'weight' : 'normal',
       'size'   : 18}
plt.rc('font', **font)
plt.title ("Main sequence spectral class - surface temperature", size=20)
- plt.plot(spektr1, temps1, "o", lw=6)
plt.plot(spektr2, temps2, "-", color="r", lw=10)
plt.grid(color='b', linestyle=':', linewidth=1)
plt.xticks(spektr1, sally1)
- plt.plot(spnum1, teff1, "x")
plt.show()
Licensing
edit
- You are free:
- to share – to copy, distribute and transmit the work
- to remix – to adapt the work
- Under the following conditions:
- attribution – You must give appropriate credit, provide a link to the license, and indicate if changes were made. You may do so in any reasonable manner, but not in any way that suggests the licensor endorses you or your use.
- share alike – If you remix, transform, or build upon the material, you must distribute your contributions under the same or compatible license as the original.
File history
Click on a date/time to view the file as it appeared at that time.
| Date/Time | Thumbnail | Dimensions | User | Comment | |
|---|---|---|---|---|---|
| current | 09:51, 13 February 2023 | | 1,131 × 711 (36 KB) | Merikanto (talk | contribs) | Uploaded own work with UploadWizard |
You cannot overwrite this file.
File usage on Commons
There are no pages that use this file.