File:Spseaice sss 2012170 chart.jpg
No higher resolution available.
Spseaice_sss_2012170_chart.jpg (720 × 183 pixels, file size: 17 KB, MIME type: image/jpeg)
Captions
Captions
Add a one-line explanation of what this file represents

|
This graph image could be re-created using vector graphics as an SVG file. This has several advantages; see Commons:Media for cleanup for more information. If an SVG form of this image is available, please upload it and afterwards replace this template with
{{vector version available|new image name}}.
It is recommended to name the SVG file “Spseaice sss 2012170 chart.svg”—then the template Vector version available (or Vva) does not need the new image name parameter. |

Summary edit
| Description |
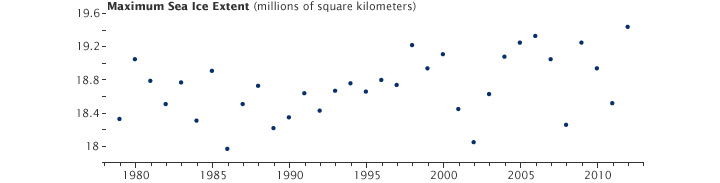
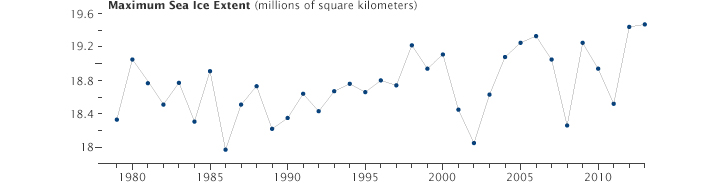
English: Antarctic sea ice cover reaches its minimum extent each year in February or March; the ice cover then grows until reaching its maximum extent in September or October. The graph above shows the maximum extent for each September since 1979 in millions of square kilometers. There is variability from year to year, though the overall trend shows growth of about 1.5 percent per decade. |
| Date | |
| Source | http://eoimages.gsfc.nasa.gov/images/imagerecords/82000/82160/spseaicemax_extent_chart_2013.jpg |
| Author | NASA Earth Observatory |
Southern Ocean around Antarctica
Licensing edit
| This file is in the public domain in the United States because it was solely created by NASA. NASA copyright policy states that "NASA material is not protected by copyright unless noted". (See Template:PD-USGov, NASA copyright policy page or JPL Image Use Policy.) | ||
 |
Warnings:
|
File history
Click on a date/time to view the file as it appeared at that time.
| Date/Time | Thumbnail | Dimensions | User | Comment | |
|---|---|---|---|---|---|
| current | 15:49, 24 June 2015 | 720 × 183 (17 KB) | HLHJ (talk | contribs) | User created page with UploadWizard |
You cannot overwrite this file.
File usage on Commons
The following page uses this file:
File usage on other wikis
The following other wikis use this file:
- Usage on bn.wikipedia.org