File:Standard symmetric pdfs.svg

Size of this PNG preview of this SVG file: 400 × 300 pixels. Other resolutions: 320 × 240 pixels | 640 × 480 pixels | 1,024 × 768 pixels | 1,280 × 960 pixels | 2,560 × 1,920 pixels.
Original file (SVG file, nominally 400 × 300 pixels, file size: 390 KB)
Captions
Captions
Add a one-line explanation of what this file represents
Summary edit
| Description |
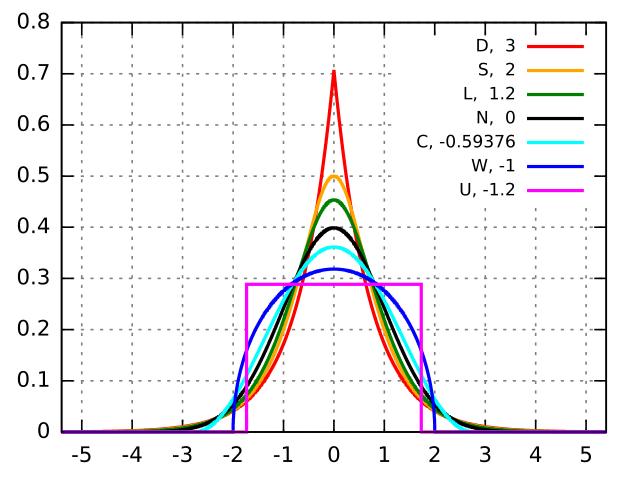
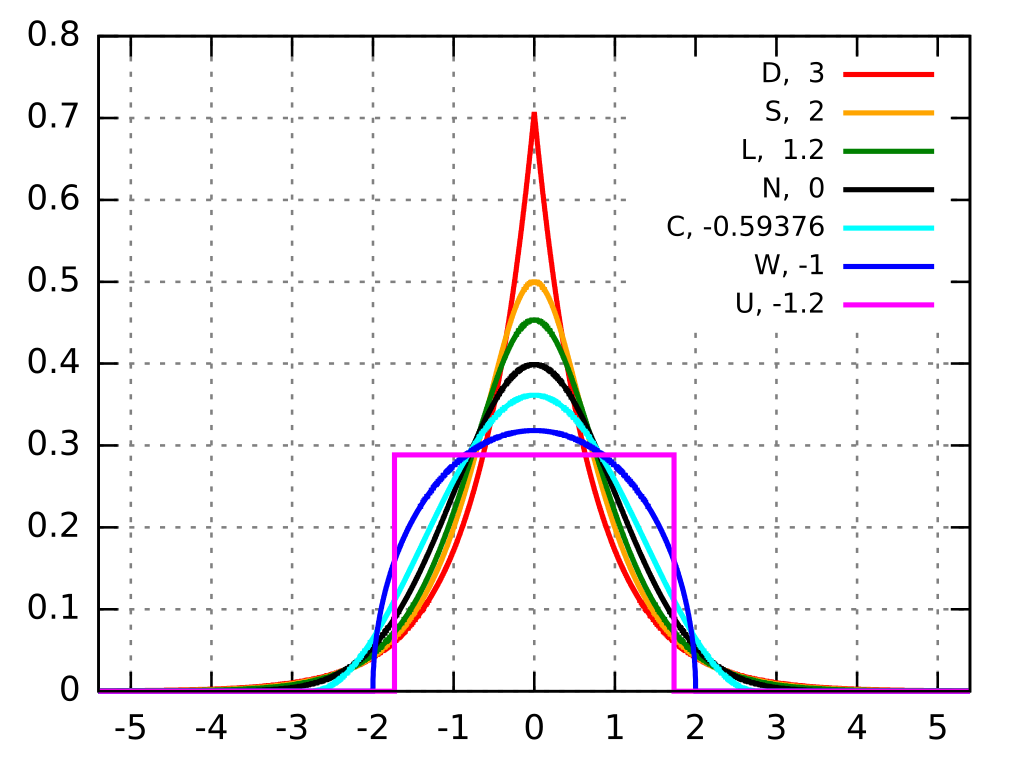
English: Plot of several symmetric unimodal probability densities with unit variance. From highest to lowest peak:
red, kurtosis 3, Laplace (D)ouble exponential distribution;
orange, kurtosis 2, hyperbolic (S)ecant distribution;
green, kurtosis 1.2, (L)ogistic distribution;
black, kurtosis 0, (N)ormal distribution;
cyan, kurtosis −0.593762…, raised (C)osine distribution;
blue, kurtosis −1, (W)igner semicircle distribution;
magenta, kurtosis −1.2, (U)niform distribution. |
||||||
| Date | |||||||
| Source | MarkSweep | ||||||
| Author |
Vector: |
||||||
| Permission (Reusing this file) |
I, the copyright holder of this work, hereby publish it under the following license:
|
||||||
| Other versions |
File:Standard symmetric pdfs logscale.svg File:Standard symmetric pdfs.png File:Standard symmetric pdfs logscale.png |
||||||
| SVG development | |||||||
| Source code | Gnuplot code# Laplace double exponential distribution, kurtosis 3
laplace(x) = exp(-abs(x)*sqrt(2)) * sqrt(0.5)
# sech distribution, kurtosis 2
sech(x) = 2.0 / (exp(x) + exp(-x))
sech_pdf(x) = 0.5 * sech(0.5*pi*x)
# logistic distribution, kurtosis 1.2
slogist = sqrt(3) / pi
logist(x) = exp(-x/slogist) / slogist / (1 + exp(-x/slogist))**2
# normal distribution, kurtosis 0
n(x) = exp(-0.5*x*x) / sqrt(2*pi)
# raised cosine distribution, kurtosis -0.59376
scos = 1.0 / sqrt(1/3.0 - 2/pi**2)
cosine(x) = abs(x)>scos? 0 : (1+cos(x*pi/scos))*0.5/scos
# Wigner semicircle distribution, kurtosis -1
wigner(x) = abs(x)>2? 0 : sqrt(4-x*x)*0.5/pi
# uniform distribution, kurtosis -1.2
uniform(x) = abs(x)>sqrt(3)? 0 : 0.5/sqrt(3)
set samples 6001
set grid
set xrange [-5.4:5.4]
set xtics 1
set key right font ",8" enhanced
set terminal svg size 400,300 enhanced fname 'DejaVu Sans' fsize 10 butt solid
set output 'Standard symmetric pdfs.svg'
plot \
laplace(x) lt 1 lw 2 title "D, 3", \
sech_pdf(x) lt 8 lw 2 title "S, 2", \
logist(x) lt 2 lw 2 title "L, 1.2", \
n(x) lt 7 lw 2 title "N, 0", \
cosine(x) lt 5 lw 2 title "C, -0.59376", \
wigner(x) lt 3 lw 2 title "W, -1", \
uniform(x) lt 4 lw 2 title "U, -1.2"
|
File history
Click on a date/time to view the file as it appeared at that time.
| Date/Time | Thumbnail | Dimensions | User | Comment | |
|---|---|---|---|---|---|
| current | 16:15, 26 May 2020 | | 400 × 300 (390 KB) | Andel (talk | contribs) | small legend tweak |
| 13:52, 26 May 2020 |  | 400 × 300 (390 KB) | Andel (talk | contribs) | == {{int:filedesc}} == {{Information |description=|Description= {{en|1=Plot of several symmetric unimodal probability densities with unit variance. From highest to lowest peak: {{Legend|red|red, kurtosis 3, Laplace (D)ouble exponential distribution;}} {{Legend|orange|orange, kurtosis 2, hyperbolic (S)ecant distribution;}} {{Legend|green|green, kurtosis 1.2, (L)ogistic distribution;}} {{Legend|black|bla... |
You cannot overwrite this file.
File usage on Commons
The following 2 pages use this file:
File usage on other wikis
The following other wikis use this file:
- Usage on ar.wikipedia.org
- Usage on be.wikipedia.org
- Usage on ca.wikipedia.org
- Usage on en.wikipedia.org
- Usage on en.wikibooks.org
- Usage on eo.wikipedia.org
- Usage on fr.wikipedia.org
- Usage on ko.wikipedia.org
- Usage on pt.wikipedia.org
- Usage on ru.wikipedia.org
- Usage on tr.wikipedia.org
- Usage on www.wikidata.org