File:TED Spread Chart - Data 2008 zh-hant.svg

Original file (SVG file, nominally 1,028 × 720 pixels, file size: 169 KB)
Captions
Captions
Summary edit
| Description |
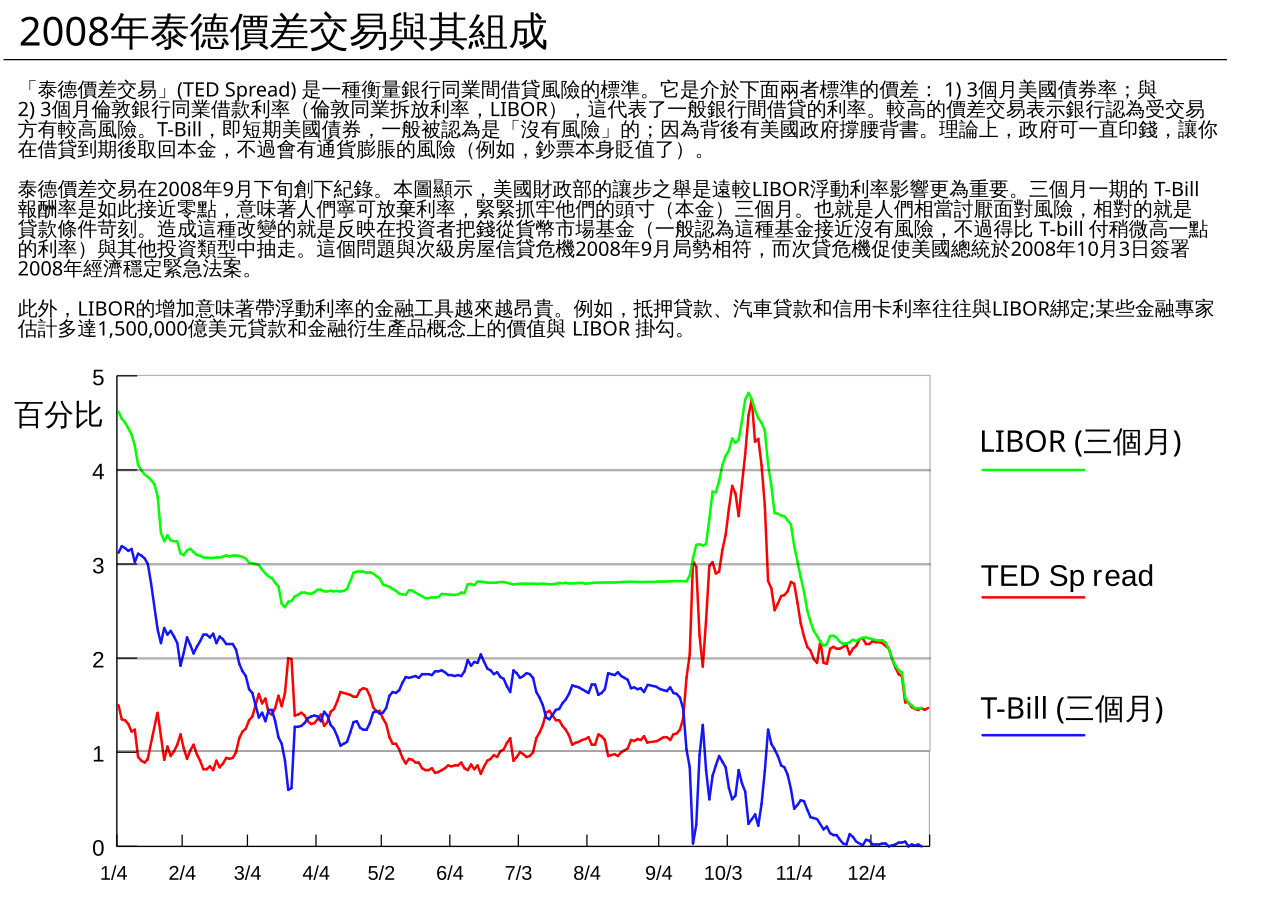
English: The “TED Spread” is a measure of credit risk for inter-bank lending. It is the difference between: 1) the three-month U.S. treasury bill rate; and 2) the three-month London Interbank Borrowing Rate (LIBOR), which represents the rate at which banks typically lend to each other. A higher spread indicates banks perceive each other as riskier counterparties. The t-bill is considered "risk-free" because the full faith and credit of the U.S. government is behind it; theoretically, the government could just print money so you will get your principal back at maturity, although there is risk of inflation (e.g., being paid back in cheaper dollars).
The TED Spread reached record levels in late September 2008. The diagram indicates that the Treasury yield movement was a more significant driver than the changes in LIBOR. A three month t-bill yield so close to zero means that people are willing to forego interest just to keep their money (principal) safe for three months--a very high level of risk aversion and indicative of tight lending conditions. Driving this change were investors shifting funds from money market funds (generally considered nearly risk free but paying a slightly higher rate of return than t-bills) and other investment types.[1] These issues are consistent with the September 2008 aspects of the subprime mortgage crisis which prompted the Emergency Economic Stabilization Act of 2008 signed into law by the U.S. President on October 3, 2008. In addition, an increase in LIBOR means that financial instruments with variable interest terms are increasingly expensive. For example, mortgages, car loans and credit card interest rates are often tied to LIBOR; some estimate as much as $150 trillion in loans and derivative notional value are tied to LIBOR.[2] |
| Date | Original date: October 4 2008; Upload date: January 19, 2009 |
| Source | en:File:TED Spread Chart - Data to 9 26 08.png |
| Author | Origin work by en:User:Farcaster; Chinese Translation by Zanhsieh |
| Other versions | en:File:TED Spread Chart - Data to 9 26 08.png |
References edit
Sources edit
Three month treasury bill rates: St. Louis Federal Reserve Bank
Three month Libor rates: Bulgarian National Bank Tables
Another libor source: BBA
Licensing edit
- You are free:
- to share – to copy, distribute and transmit the work
- to remix – to adapt the work
- Under the following conditions:
- attribution – You must give appropriate credit, provide a link to the license, and indicate if changes were made. You may do so in any reasonable manner, but not in any way that suggests the licensor endorses you or your use.
- share alike – If you remix, transform, or build upon the material, you must distribute your contributions under the same or compatible license as the original.
File history
Click on a date/time to view the file as it appeared at that time.
| Date/Time | Thumbnail | Dimensions | User | Comment | |
|---|---|---|---|---|---|
| current | 23:33, 27 January 2009 | | 1,028 × 720 (169 KB) | Zanhsieh (talk | contribs) | {{Information |Description={{en|1=The “TED Spread” is a measure of credit risk for inter-bank lending. It is the difference between: 1) the three-month U.S. treasury bill rate; and 2) the three-month London Interbank Borrowing Rate (LIBOR), which repr |
| 05:41, 20 January 2009 |  | 1,028 × 720 (163 KB) | Zanhsieh (talk | contribs) | {{Information |Description={{en|1=The “TED Spread” is a measure of credit risk for inter-bank lending. It is the difference between: 1) the three-month U.S. treasury bill rate; and 2) the three-month London Interbank Borrowing Rate (LIBOR), which repr |
You cannot overwrite this file.
File usage on Commons
There are no pages that use this file.
File usage on other wikis
The following other wikis use this file:
- Usage on zh.wikipedia.org