File:Tail Function Graph.svg

Size of this PNG preview of this SVG file: 529 × 600 pixels. Other resolutions: 212 × 240 pixels | 423 × 480 pixels | 678 × 768 pixels | 903 × 1,024 pixels | 1,807 × 2,048 pixels | 750 × 850 pixels.
Original file (SVG file, nominally 750 × 850 pixels, file size: 305 KB)
Captions
Captions
Add a one-line explanation of what this file represents
| Description |
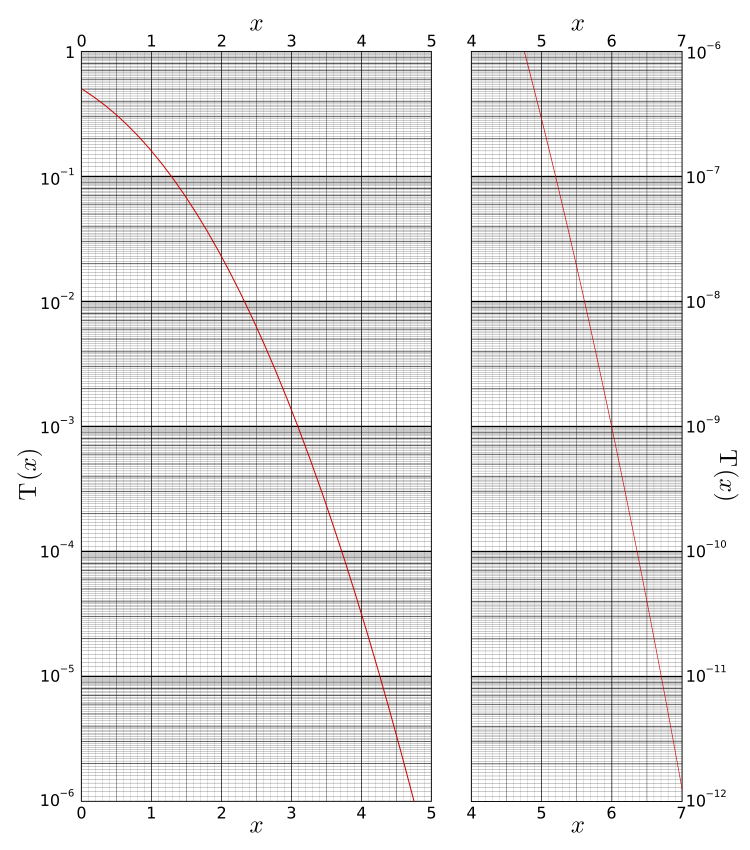
English: A graph of the Gaussian tail function (the area under the N(0,1) distribution from x to +∞). This is given by:
|
||
| Date | |||
| Source | Own work | ||
| Author | Inductiveload | ||
| Permission (Reusing this file) |
|
||
| Other versions |
|

File history
Click on a date/time to view the file as it appeared at that time.
| Date/Time | Thumbnail | Dimensions | User | Comment | |
|---|---|---|---|---|---|
| current | 04:48, 9 May 2009 | | 750 × 850 (305 KB) | Inductiveload (talk | contribs) | fix wrong axis |
| 04:18, 9 May 2009 |  | 750 × 850 (305 KB) | Inductiveload (talk | contribs) | removed explanatory text - can be given in the text of the article | |
| 04:10, 9 May 2009 |  | 744 × 1,052 (280 KB) | Inductiveload (talk | contribs) | {{Information |Description={{en|1=A graph of the Gaussian tail function (the area under the N(0,1) distribution from ''x'' to +∞). This is given by: :<math>\mbox{T}(x) = \int\limits_x^\infty {{1 \over {\sqrt {2\pi } }}\exp \left( { - {{y^2 } \over 2}} |
You cannot overwrite this file.
File usage on Commons
There are no pages that use this file.
File usage on other wikis
The following other wikis use this file:
- Usage on en.wikibooks.org