File:TaylorCosAllSVG.svg

Size of this PNG preview of this SVG file: 680 × 600 pixels. Other resolutions: 272 × 240 pixels | 544 × 480 pixels | 870 × 768 pixels | 1,161 × 1,024 pixels | 2,321 × 2,048 pixels.
Original file (SVG file, nominally 680 × 600 pixels, file size: 1.37 MB)
Captions
Captions
Add a one-line explanation of what this file represents
Summary
edit
| Description |
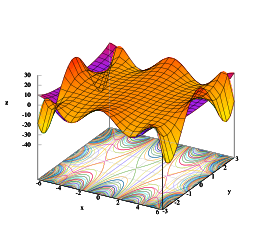
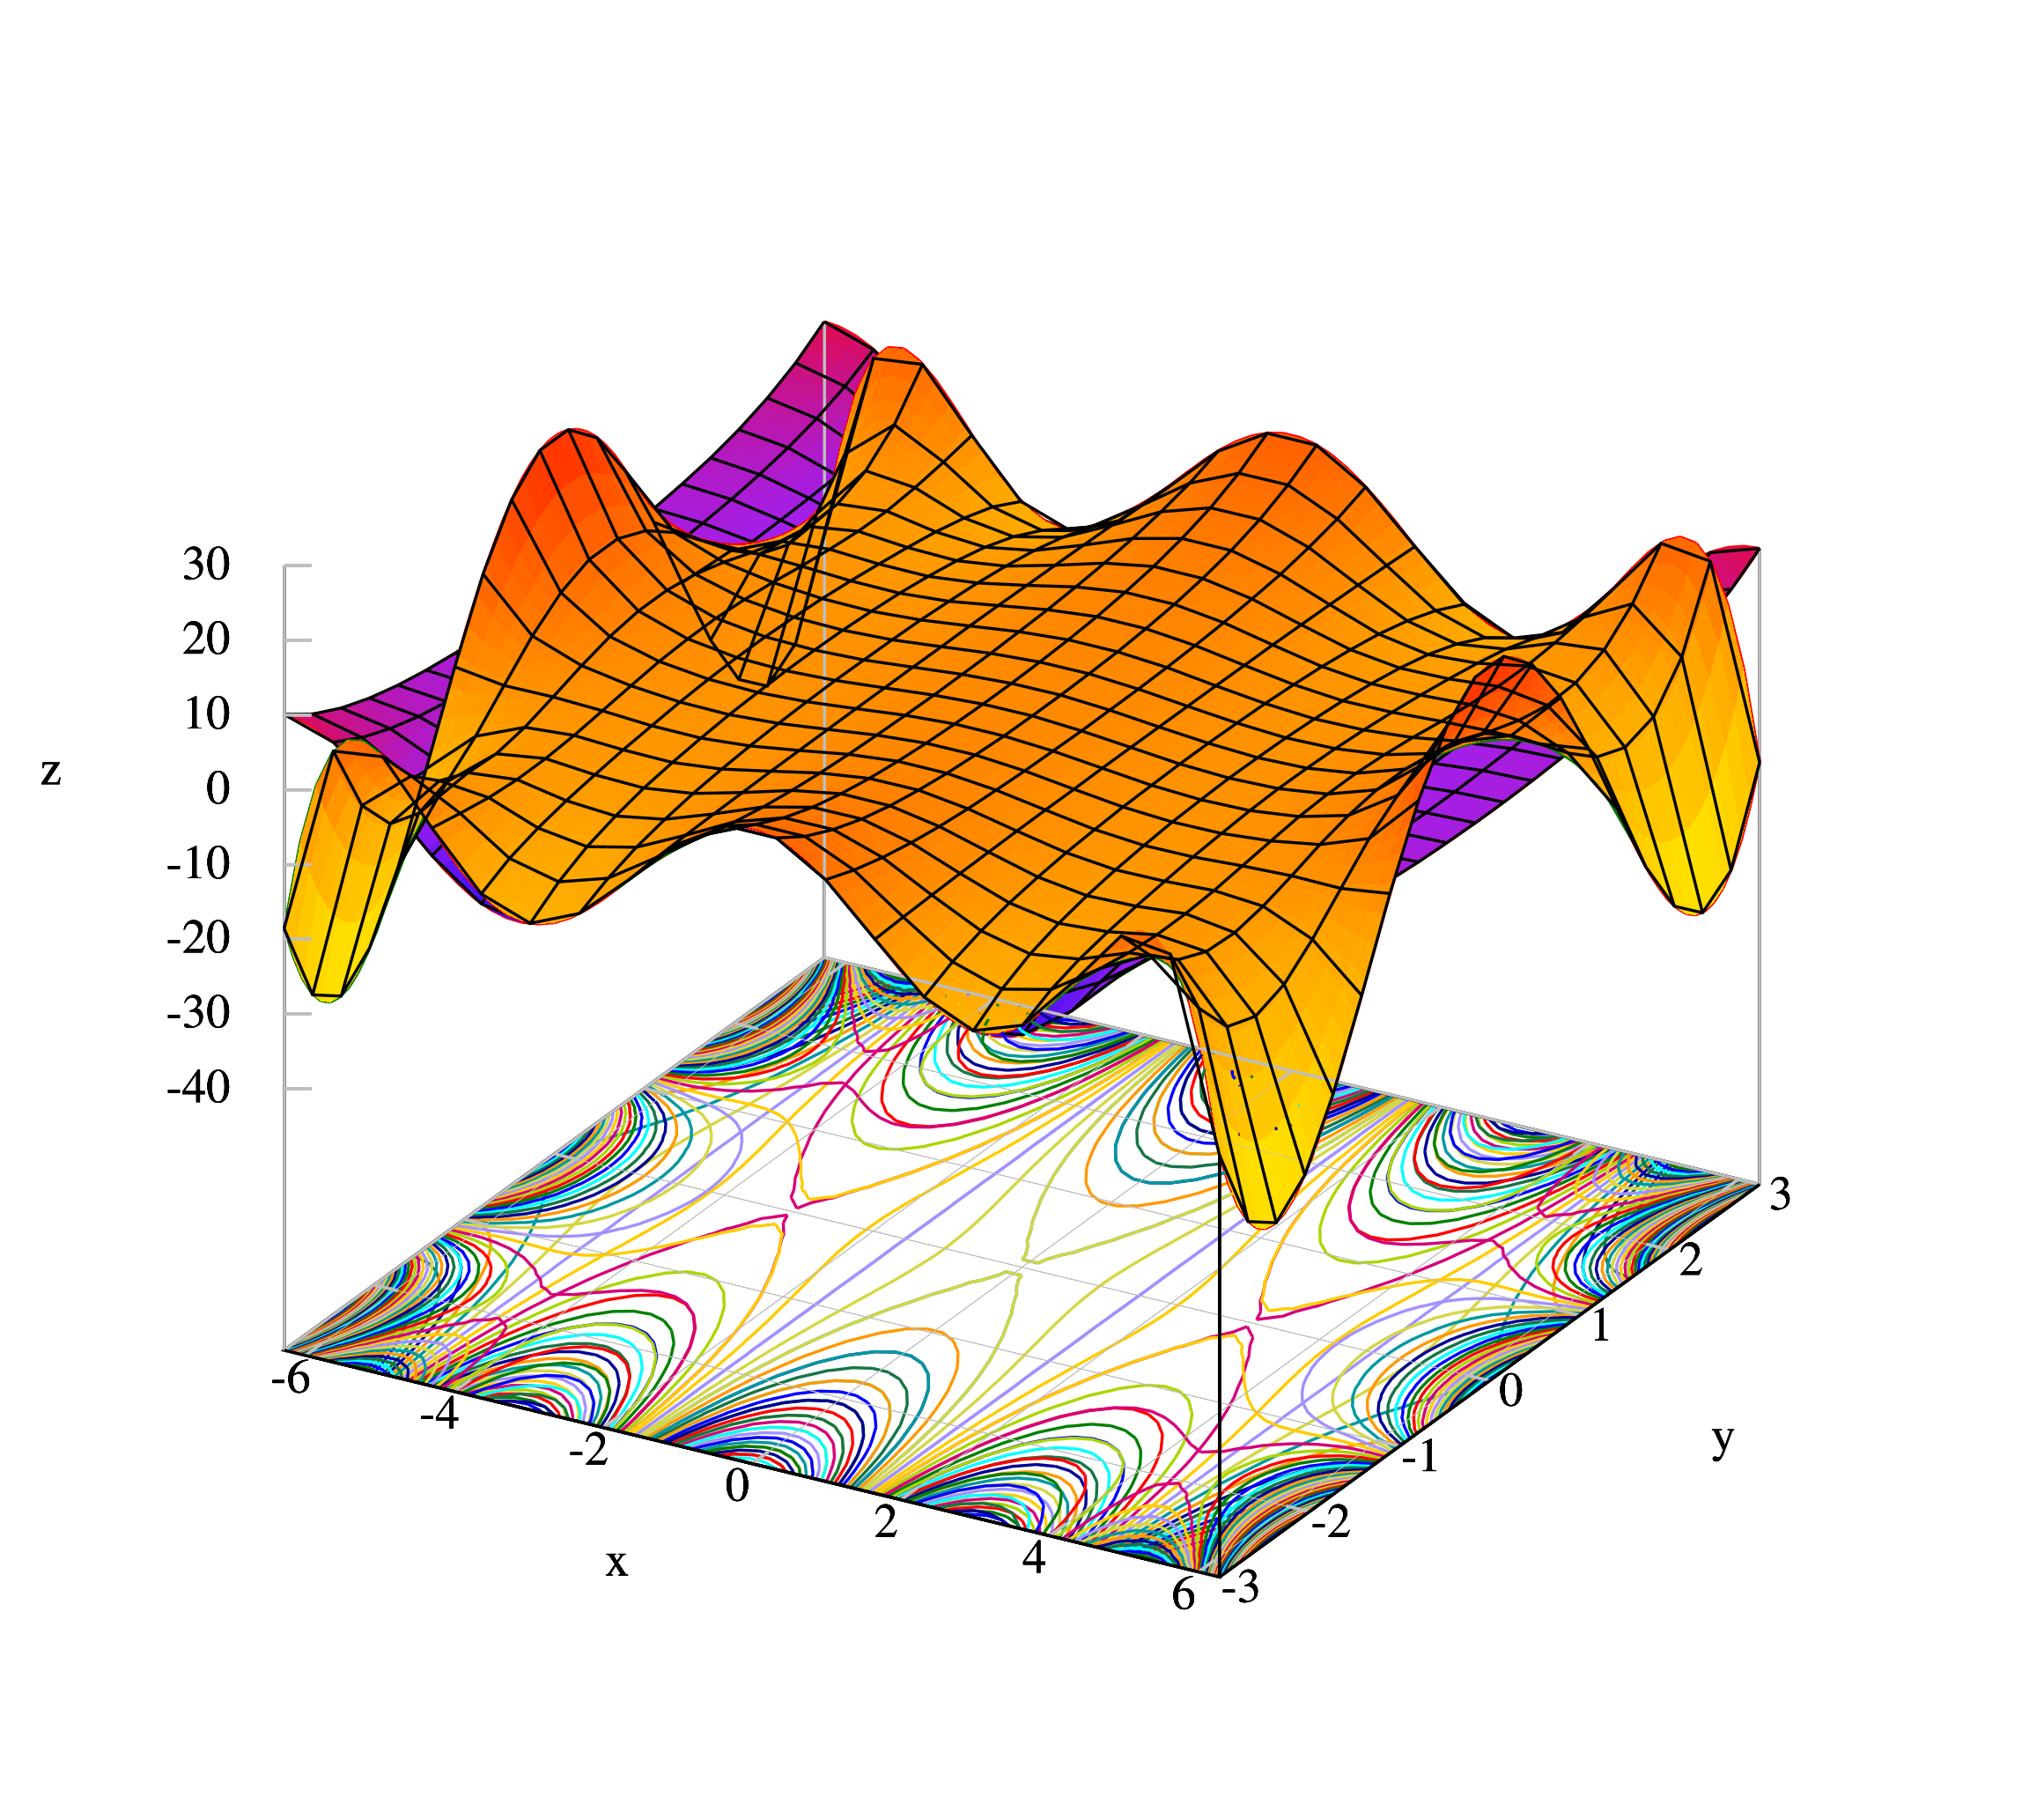
English: SVG edition for z=Re(cos(x+iy)) and its 8-degree Taylor expansion. |
| Date | |
| Source | Own work |
| Author | IkamusumeFan |
Generated by Gnuplot.
Licensing
edit
I, the copyright holder of this work, hereby publish it under the following license:
This file is licensed under the Creative Commons Attribution-Share Alike 3.0 Unported license.
- You are free:
- to share – to copy, distribute and transmit the work
- to remix – to adapt the work
- Under the following conditions:
- attribution – You must give appropriate credit, provide a link to the license, and indicate if changes were made. You may do so in any reasonable manner, but not in any way that suggests the licensor endorses you or your use.
- share alike – If you remix, transform, or build upon the material, you must distribute your contributions under the same or compatible license as the original.
Gnuplot
edit
set term svg size 680,600 enhanced font 'Times,12'
#set term post eps enhanced color font 'Times,12' linewidth 2
set output 'TaylorCosAllSVG.svg'

set multiplot

set cntrparam levels 100
set contour base
set isosamples 60,60
set samples 60,60
set xlabel "x"
set ylabel "y"
set zlabel "z"
set xrange [-2*pi:2*pi]
set yrange [-3:3]
set zrange [-40:30]
unset colorbox
unset key

# Draw the surface
set pm3d
set hidd
set grid layerdefault linetype -1 linecolor rgb "gray"  linewidth 0.200, linetype -1 linecolor rgb "gray"  linewidth 0.200
set palette defined (-1 "blue", 0 "purple", 1 "red")
i = {0.0,1.0}
splot real(cos(x+i*y))
# Draw the lines
unset cntrparam
unset contour
unset pm3d
unset hidd
set isosamples 20,20
set samples 20,20
splot real(cos(x+i*y)) lt rgb "black"

# Draw the surface
set zrange [-40:30]
set cntrparam levels 100
set contour base
set isosamples 60,60
set samples 60,60
set pm3d
set hidd
set grid layerdefault linetype -1 linecolor rgb "gray"  linewidth 0.200, linetype -1 linecolor rgb "gray"  linewidth 0.200
set palette defined (-1 "yellow", 0 "orange", 1 "red")
i = {0.0,1.0}
splot real(1-(x+i*y)**2/2! + (x+i*y)**4/4! - (x+i*y)**6/6! +(x+i*y)**8/8!)
# Draw the lines
unset cntrparam
unset contour
unset pm3d
unset hidd
set isosamples 20,20
set samples 20,20
splot real(1-(x+i*y)**2/2! + (x+i*y)**4/4! - (x+i*y)**6/6! +(x+i*y)**8/8!) lt rgb "black"
set view 29,53

unset multiplot
set term x11
set output
File history
Click on a date/time to view the file as it appeared at that time.
| Date/Time | Thumbnail | Dimensions | User | Comment | |
|---|---|---|---|---|---|
| current | 11:18, 22 July 2013 | | 680 × 600 (1.37 MB) | IkamusumeFan (talk | contribs) | User created page with UploadWizard |
You cannot overwrite this file.
File usage on Commons
There are no pages that use this file.
File usage on other wikis
The following other wikis use this file:
- Usage on hi.wikipedia.org
- Usage on hy.wikipedia.org
- Usage on uk.wikipedia.org
- Usage on zh.wikipedia.org