File:Titan atmosphere detail de.svg

Size of this PNG preview of this SVG file: 800 × 600 pixels. Other resolutions: 320 × 240 pixels | 640 × 480 pixels | 1,024 × 768 pixels | 1,280 × 960 pixels | 2,560 × 1,919 pixels | 1,191 × 893 pixels.
Original file (SVG file, nominally 1,191 × 893 pixels, file size: 204 KB)
Captions
Captions
Add a one-line explanation of what this file represents
Summary edit
| Description |
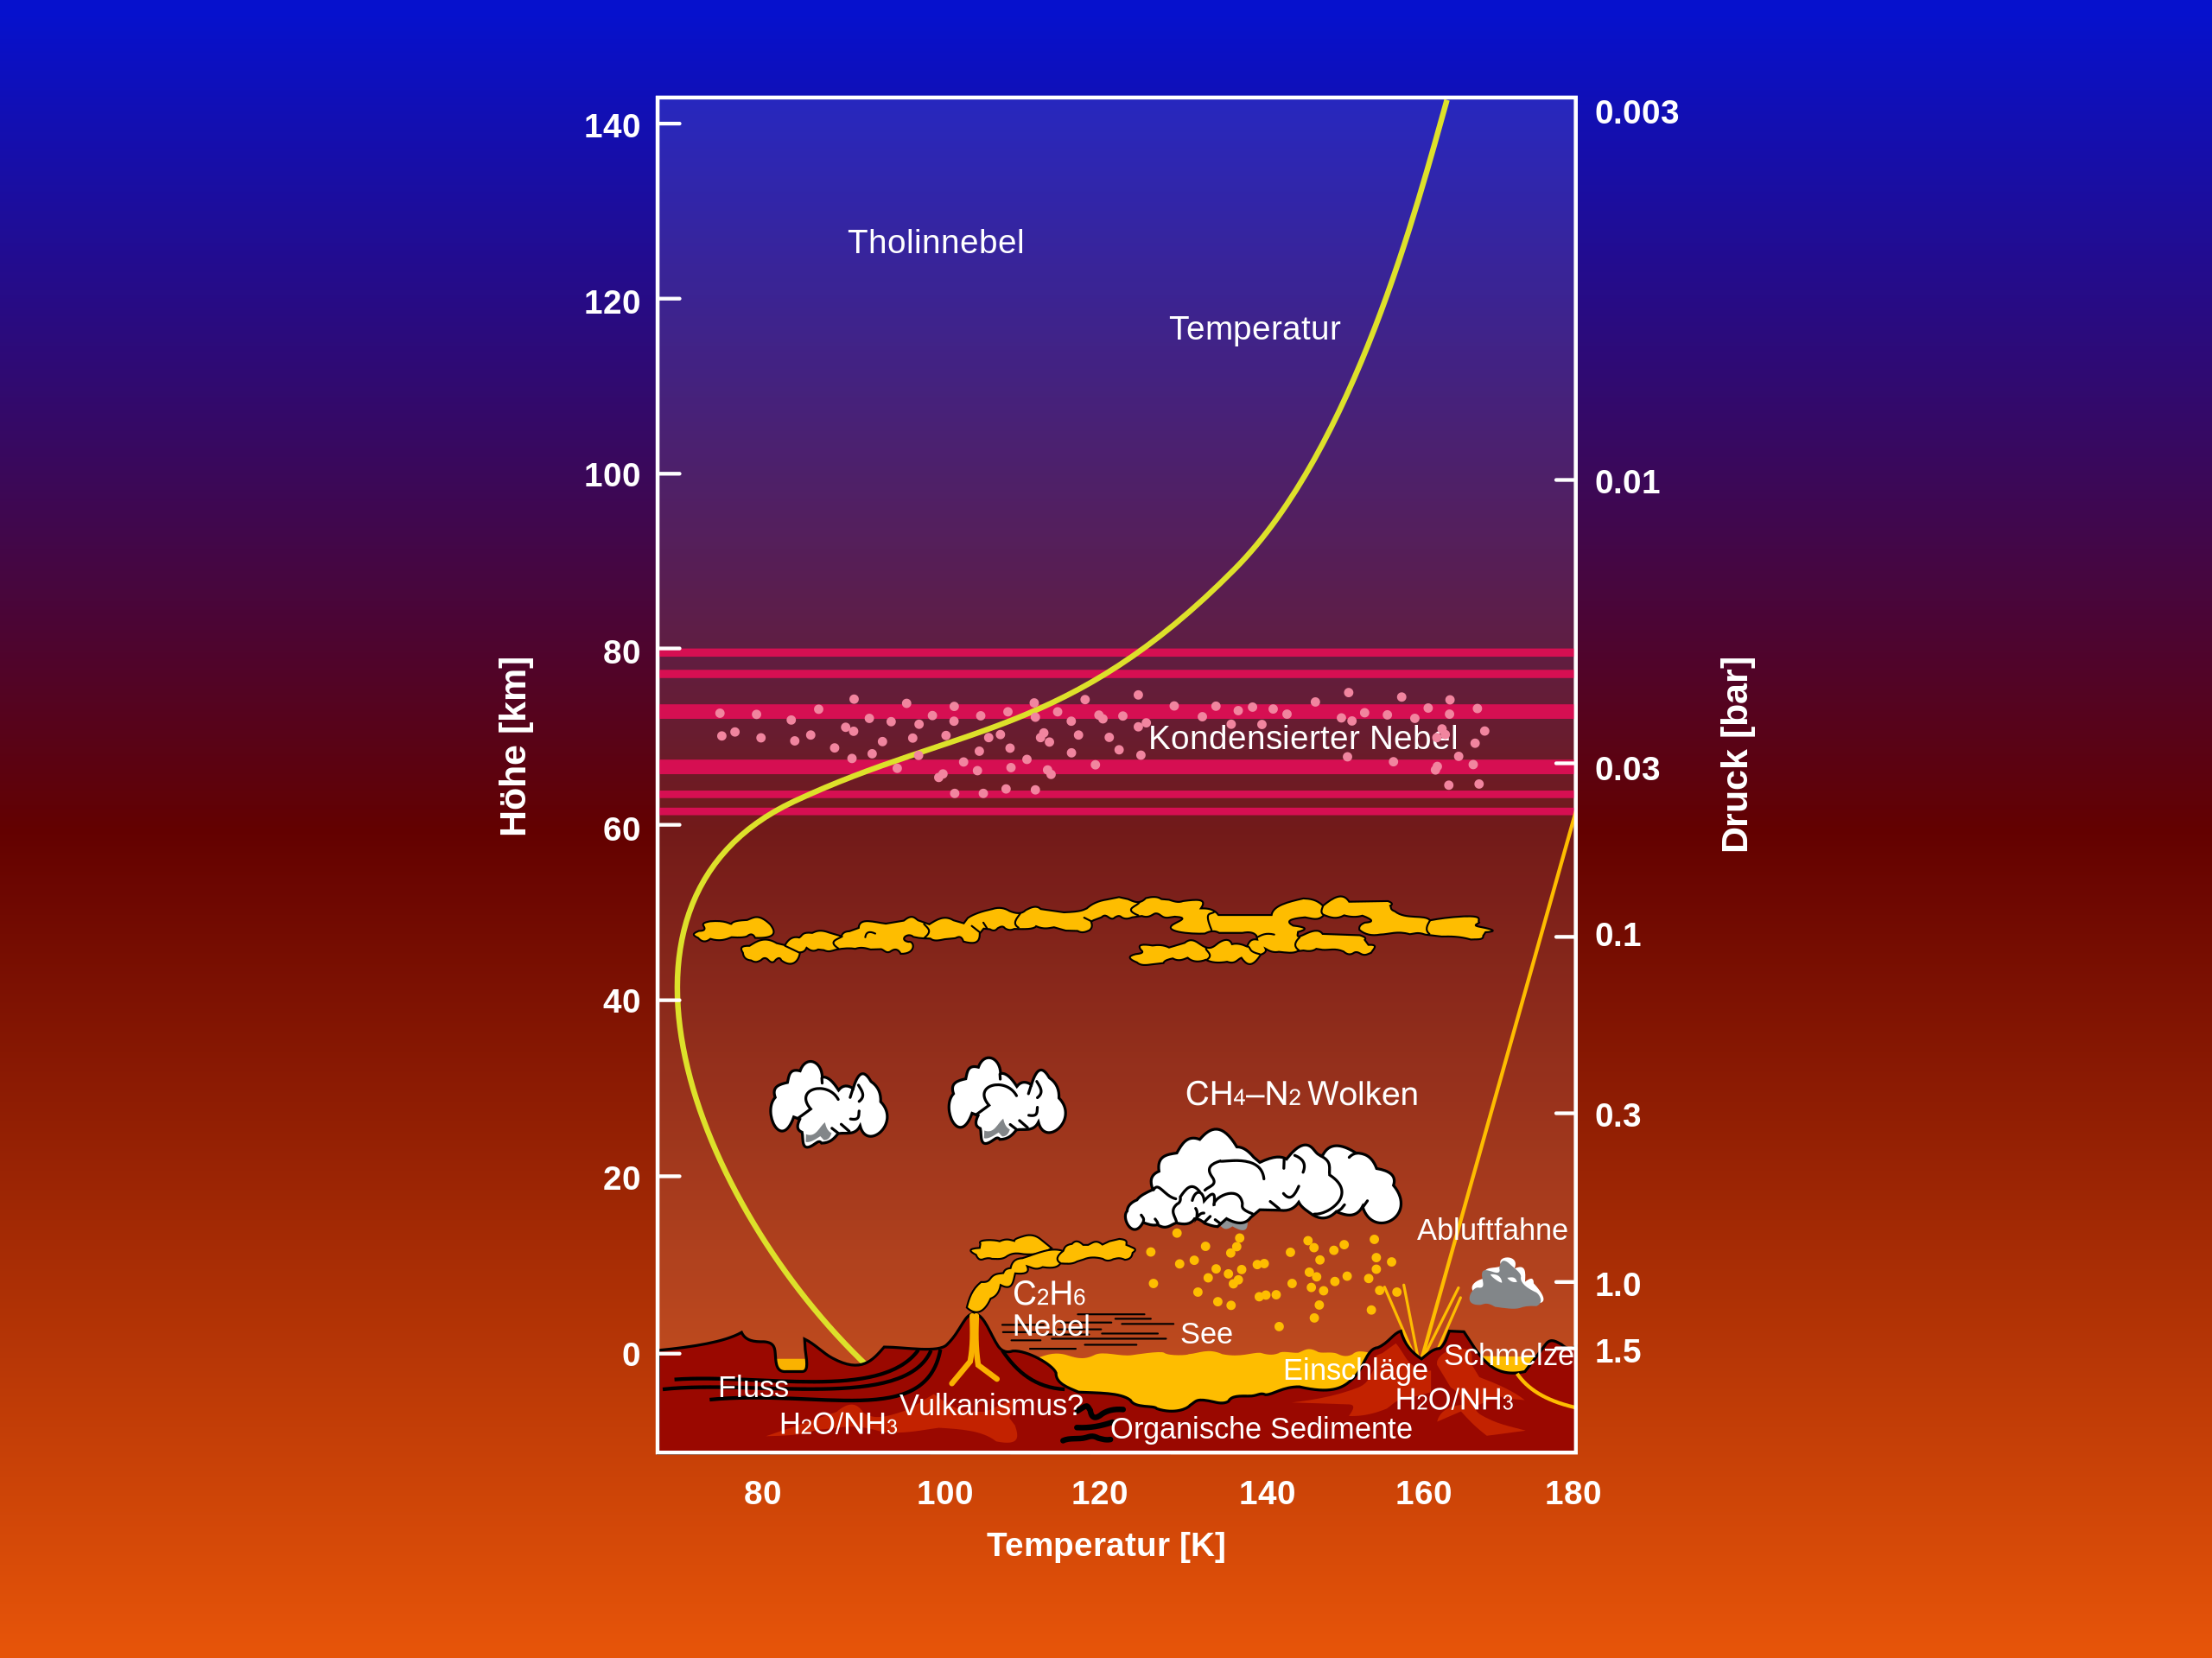
Deutsch: Eine Grafik, die Temperatur, Druck und andere Aspekte des Klimas von Titan zeigt. Die Nebelschicht in der Atmosphäre verringert die Temperatur in der unteren Atmosphäre, während Methan die Temperatur auf der Oberfläche ansteigen lässt. Kryovulkane stossen Methan in die Atmosphäre aus, um daraufhin auf die Oberfläche niederregnen, um schließlich Seen zu formen.
English: A graph detailing temperature, pressure, and other aspects of Titan's climate. The atmospheric haze lowers the temperature in the lower atmosphere, while methane raises the temperature at the surface. Cryovolcanoes erupt methane into the atmosphere, which then rains down onto the surface, forming lakes.
Română: Grafic cu detalii privind temperatura, presiunea şi alte aspecte ale climei de pe Titan. Ceața atmosferică scade temperatura în atmosfera inferioară, în timp ce metanul ridică temperatura la suprafață. Criovulcanii aruncă metan în atmosferă, care apoi cad sub formă de ploaie pe suprafață, formând lacuri. |
| Date | |
| Source | NASA (http://www.jpl.nasa.gov/media/cassini-102504/visuals.html); vectorized in Inkscape by Mysid |
| Author |
NASA (original), Mysid (SVG) Translator: FrancescoA |
| Other versions | Titan atmosphere detail.svg |
Licensing edit
| This file is in the public domain in the United States because it was solely created by NASA. NASA copyright policy states that "NASA material is not protected by copyright unless noted". (See Template:PD-USGov, NASA copyright policy page or JPL Image Use Policy.) | ||
 |
Warnings:
|
File history
Click on a date/time to view the file as it appeared at that time.
| Date/Time | Thumbnail | Dimensions | User | Comment | |
|---|---|---|---|---|---|
| current | 10:45, 14 November 2009 | | 1,191 × 893 (204 KB) | Chrkl (talk | contribs) | Parts of the text with subscript converted in paths to display correctly, REVERT this version once MW is able to render correctly! |
| 15:49, 13 November 2009 |  | 1,191 × 893 (179 KB) | FrancescoA (talk | contribs) | Moved texts a little bit. | |
| 23:32, 12 November 2009 |  | 1,191 × 893 (180 KB) | FrancescoA (talk | contribs) | == Summary == {{Information |Description={{de|1=Eine Grafik, die Temperatur, Druck und andere Aspekte des Klimas von Titan zeigt. Die Nebelschicht in der Atmosphäre verringert die Temperatur in der unteren Atmosphäre, während Methan die T | |
| 23:22, 12 November 2009 |  | 1,191 × 893 (180 KB) | FrancescoA (talk | contribs) | == Summary == {{Information |Description={{it|1=Grafico che descrive la temperatura, la pressione ed altri aspetti dell'atmosfera e del clima di Titan. Gli strati di foschia nell'atmosferma abbassano la temperatur |
You cannot overwrite this file.
File usage on Commons
The following page uses this file:
File usage on other wikis
The following other wikis use this file:
- Usage on de.wikipedia.org
- Usage on en.wikipedia.org
- Usage on lb.wikipedia.org