File:Trends in global average absolute sea level, 1870-2008 (US EPA).png
Size of this preview: 560 × 599 pixels. Other resolutions: 224 × 240 pixels | 449 × 480 pixels | 670 × 717 pixels.
Original file (670 × 717 pixels, file size: 61 KB, MIME type: image/png)
Captions
Captions
Add a one-line explanation of what this file represents
Summary edit
.png&action=edit§ion=1)
| Description |
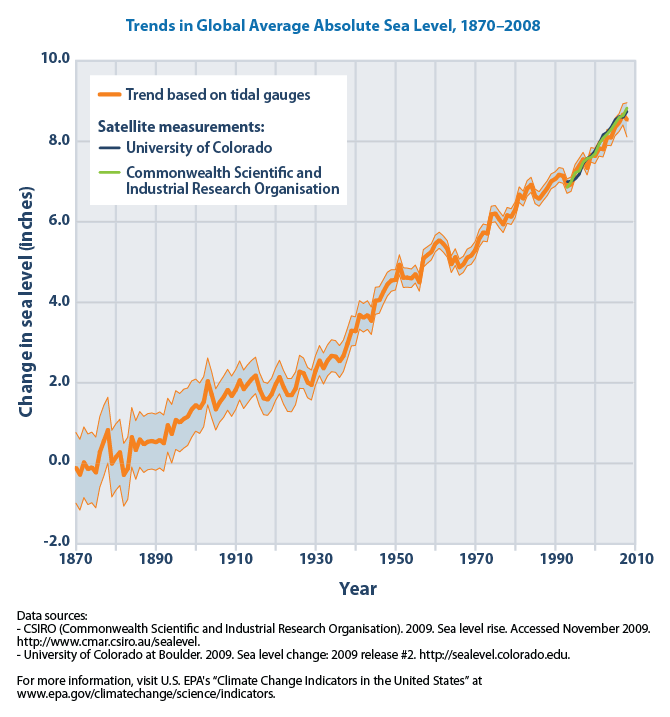
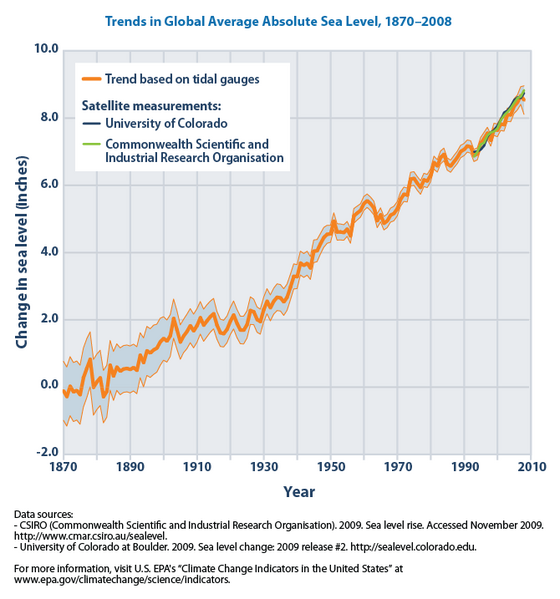
English: This image shows trends in global average absolute sea level between 1870 and 2008. From the cited public-domain source (US Environmental Protection Agency (US EPA), 2010): "After a period of approximately 2,000 years of little change, average sea levels rose worldwide throughout the 20th century, and the rate of change has accelerated in recent years. [...] When averaged over all the world's oceans, absolute sea level increased at an average rate of 0.06 inches per year from 1870 to 2008 [...] From 1993 to 2008, however, average sea level rose at a rate of 0.11 to 0.13 inches per year—roughly twice as fast as the long-term trend. [...] While absolute sea level has increased steadily overall, particularly in recent decades, regional trends vary, and absolute sea level has decreased in some places [...] Relative sea level also has not risen uniformly because of regional and local changes in land movement and long-term changes in coastal circulation patterns." |
| Date | |
| Source | Sea level: Climate Change: US EPA. Publisher: US EPA |
| Author | US EPA |
| Permission (Reusing this file) |
EPA Climate Change FAQ > Topic > Website > Can I use this graphic/information I found on your website? Topic #: 23002-14698, Date Created: 9/2/2007, Last Modified Since: 6/6/2012: "[...] All of the graphics and information on EPA’s Climate Change Web site, with the exception of the graphics from the Koshland Science Museum of the National Academy of Sciences, and the EPA seal and logo are in the public domain. A credit is appreciated (e.g. Source: U.S. EPA Climate Change Website) [...]" |
Licensing edit
.png&action=edit§ion=2)
This image (or other media) is a work of an Environmental Protection Agency employee, taken or made as part of that person's official duties. As works of the U.S. federal government, all EPA images are in the public domain.
|
||
File history
Click on a date/time to view the file as it appeared at that time.
| Date/Time | Thumbnail | Dimensions | User | Comment | |
|---|---|---|---|---|---|
| current | 20:22, 8 August 2012 | | 670 × 717 (61 KB) | Enescot (talk | contribs) | {{Information |Description ={{en|1=This image shows trends in global average absolute sea level between 1870 and 2008. From the cited public-domain source (US Environmental Protection Agency (US EPA), 2010): "After a period of approximately 2,000 ye... |
You cannot overwrite this file.
File usage on Commons
There are no pages that use this file.
File usage on other wikis
The following other wikis use this file:
- Usage on ar.wikipedia.org
- Usage on bn.wikipedia.org
- Usage on nn.wikipedia.org
- Usage on pt.wikipedia.org
- Usage on sh.wikipedia.org
.png&oldid=517009466)