File:Tungsten OR wolfram (mined)2.PNG
Size of this preview: 800 × 351 pixels. Other resolutions: 320 × 140 pixels | 640 × 281 pixels | 1,425 × 625 pixels.
Original file (1,425 × 625 pixels, file size: 57 KB, MIME type: image/png)
Captions
Captions
Add a one-line explanation of what this file represents
Summary
edit2.PNG&action=edit§ion=1)

|
This economic map image could be re-created using vector graphics as an SVG file. This has several advantages; see Commons:Media for cleanup for more information. If an SVG form of this image is available, please upload it and afterwards replace this template with
{{vector version available|new image name}}.
It is recommended to name the SVG file “Tungsten OR wolfram (mined)2.svg”—then the template Vector version available (or Vva) does not need the new image name parameter. |
| Description |
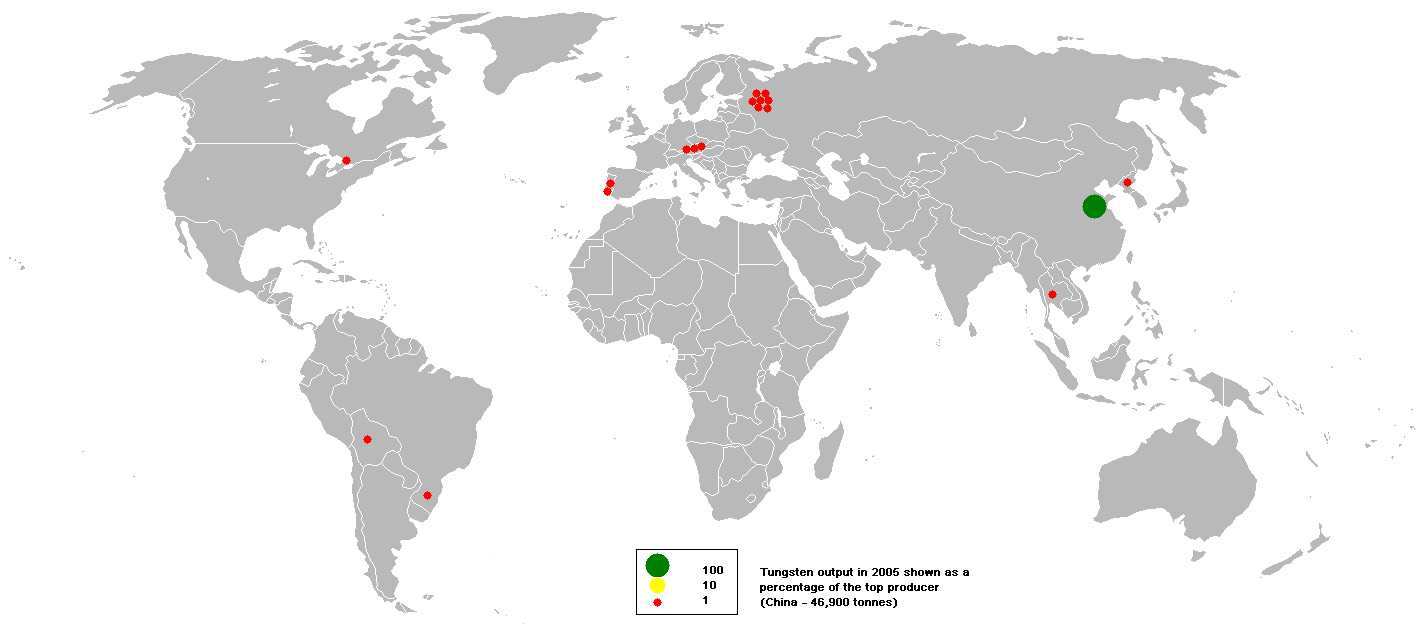
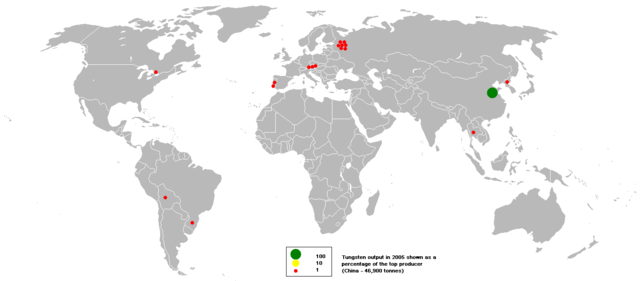
English: This bubble map shows the global distribution of mined output of tungsten in 2005 as a percentage of the the top producer (China - 46,900 tonnes).
This map is consistent with incomplete set of data too as long as the top producer is known. It resolves the accessibility issues faced by colour-coded maps that may not be properly rendered in old computer screens. Data was extracted on 29th May 2007. Source - http://www.bgs.ac.uk/mineralsuk/commodity/world/home.html Based on :Image:BlankMap-World.png |
| Date | 29 May 2007 (original upload date) |
| Source | Transferred from en.wikipedia to Commons. |
| Author | Anwar saadat at English Wikipedia |
Licensing
edit2.PNG&action=edit§ion=2)
| This work has been released into the public domain by its author, Anwar saadat at English Wikipedia. This applies worldwide. In some countries this may not be legally possible; if so: Anwar saadat grants anyone the right to use this work for any purpose, without any conditions, unless such conditions are required by law. |
Original upload log
edit2.PNG&action=edit§ion=3)
The original description page was here. All following user names refer to en.wikipedia.
- 2007-05-29 15:47 Anwar saadat 1425×625× (58458 bytes) This bubble map shows the global distribution of mined output of tungsten in 2005 as a percentage of the the top producer (China - 47,000 tonnes). This map is consistent with incomplete set of data too as long as the top producer is known. It resolves th
[1]
File history
Click on a date/time to view the file as it appeared at that time.
| Date/Time | Thumbnail | Dimensions | User | Comment | |
|---|---|---|---|---|---|
| current | 18:16, 28 May 2010 | | 1,425 × 625 (57 KB) | Conung (talk | contribs) | {{Information |Description= This bubble map shows the global distribution of mined output of tungsten in 2005 as a percentage of the the top producer (China - 46,900 tonnes). |Source=Image:BlankMap-World.png |D |
You cannot overwrite this file.
File usage on Commons
There are no pages that use this file.
File usage on other wikis
The following other wikis use this file:
- Usage on vi.wikipedia.org
2.PNG&oldid=533468484)