File:U.S. Budget Deficits CBO 2009 Forecast vs Actual.png
Size of this preview: 800 × 474 pixels. Other resolutions: 320 × 190 pixels | 640 × 379 pixels | 1,224 × 725 pixels.
Original file (1,224 × 725 pixels, file size: 88 KB, MIME type: image/png)
Captions
Captions
Add a one-line explanation of what this file represents
Understanding the chart edit
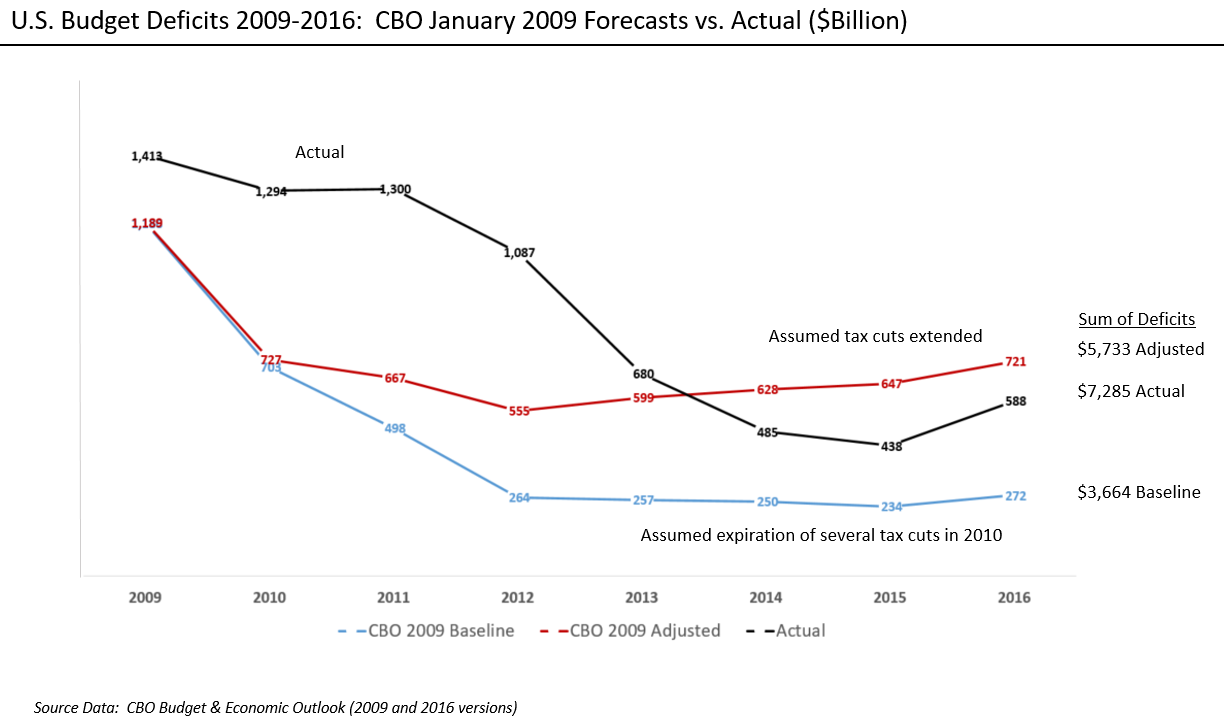
The chart shows three data series from the Congressional Budget Office Budget & Economic Outlook documents for 2009 (forecasts) and 2016 (actual).
- CBO January 2009 baseline, which assumed the Bush tax cuts of 2001 and 2003 would expire in 2010, along with other smaller tax cut expiration.[1] Sum of deficits: $3.7 trillion.
- CBO January 2009 baseline adjusted, assuming the tax cuts would not expire. This data necessary to construct this series is provided in an alternate CBO scenario available in the supplemental data spreadsheets supporting the CBO report. Add the effects of the Bush tax cut extension and other tax cut extensions to the baseline series to derive this series. Sum of deficits: $5.7 trillion.
- Actual deficits reported by the CBO for 2009-2016. The 2016 deficit statistic is from the CBO Monthly Budget Outlook for October 2016. Sum of deficits: $7.3 trillion
Sources edit
- ↑ CBO Budget and Economic Outlook 2009-2019. CBO. Retrieved on November 21, 2016.
Summary edit
| Description |
English: Image compares U.S. budget deficits forecast by CBO in 2009 under two scenarios and the actual budget deficits that occurred during the Obama administration. |
| Date | |
| Source | Line chart based on CBO data |
| Author | Farcaster |
Licensing edit
I, the copyright holder of this work, hereby publish it under the following licenses:

|
Permission is granted to copy, distribute and/or modify this document under the terms of the GNU Free Documentation License, Version 1.2 or any later version published by the Free Software Foundation; with no Invariant Sections, no Front-Cover Texts, and no Back-Cover Texts. A copy of the license is included in the section entitled GNU Free Documentation License. |
This file is licensed under the Creative Commons Attribution-Share Alike 4.0 International license.
- You are free:
- to share – to copy, distribute and transmit the work
- to remix – to adapt the work
- Under the following conditions:
- attribution – You must give appropriate credit, provide a link to the license, and indicate if changes were made. You may do so in any reasonable manner, but not in any way that suggests the licensor endorses you or your use.
- share alike – If you remix, transform, or build upon the material, you must distribute your contributions under the same or compatible license as the original.
You may select the license of your choice.
File history
Click on a date/time to view the file as it appeared at that time.
| Date/Time | Thumbnail | Dimensions | User | Comment | |
|---|---|---|---|---|---|
| current | 14:41, 26 January 2017 | | 1,224 × 725 (88 KB) | Farcaster (talk | contribs) | Update |
| 16:58, 21 January 2017 |  | 1,088 × 727 (84 KB) | Farcaster (talk | contribs) | Colors | |
| 23:36, 4 December 2016 |  | 1,343 × 782 (136 KB) | Farcaster (talk | contribs) | Add $ billions to header | |
| 20:16, 23 November 2016 |  | 1,221 × 726 (88 KB) | Farcaster (talk | contribs) | Added notation to lines | |
| 19:42, 23 November 2016 |  | 1,227 × 725 (85 KB) | Farcaster (talk | contribs) | {{subst:Upload marker added by en.wp UW}} {{Information |Description = {{en|Image compares U.S. budget deficits forecast by CBO in 2009 under two scenarios and the actual budget deficits that occurred during the Obama administration.}} |Source = Line c... |
You cannot overwrite this file.
File usage on Commons
There are no pages that use this file.
File usage on other wikis
The following other wikis use this file:
- Usage on en.wikipedia.org