File:Variograma experimental.png
Size of this preview: 800 × 445 pixels. Other resolutions: 320 × 178 pixels | 640 × 356 pixels | 1,024 × 569 pixels | 1,280 × 711 pixels | 2,100 × 1,167 pixels.
Original file (2,100 × 1,167 pixels, file size: 43 KB, MIME type: image/png)
Captions
Captions
Add a one-line explanation of what this file represents
Summary
edit
| Description |
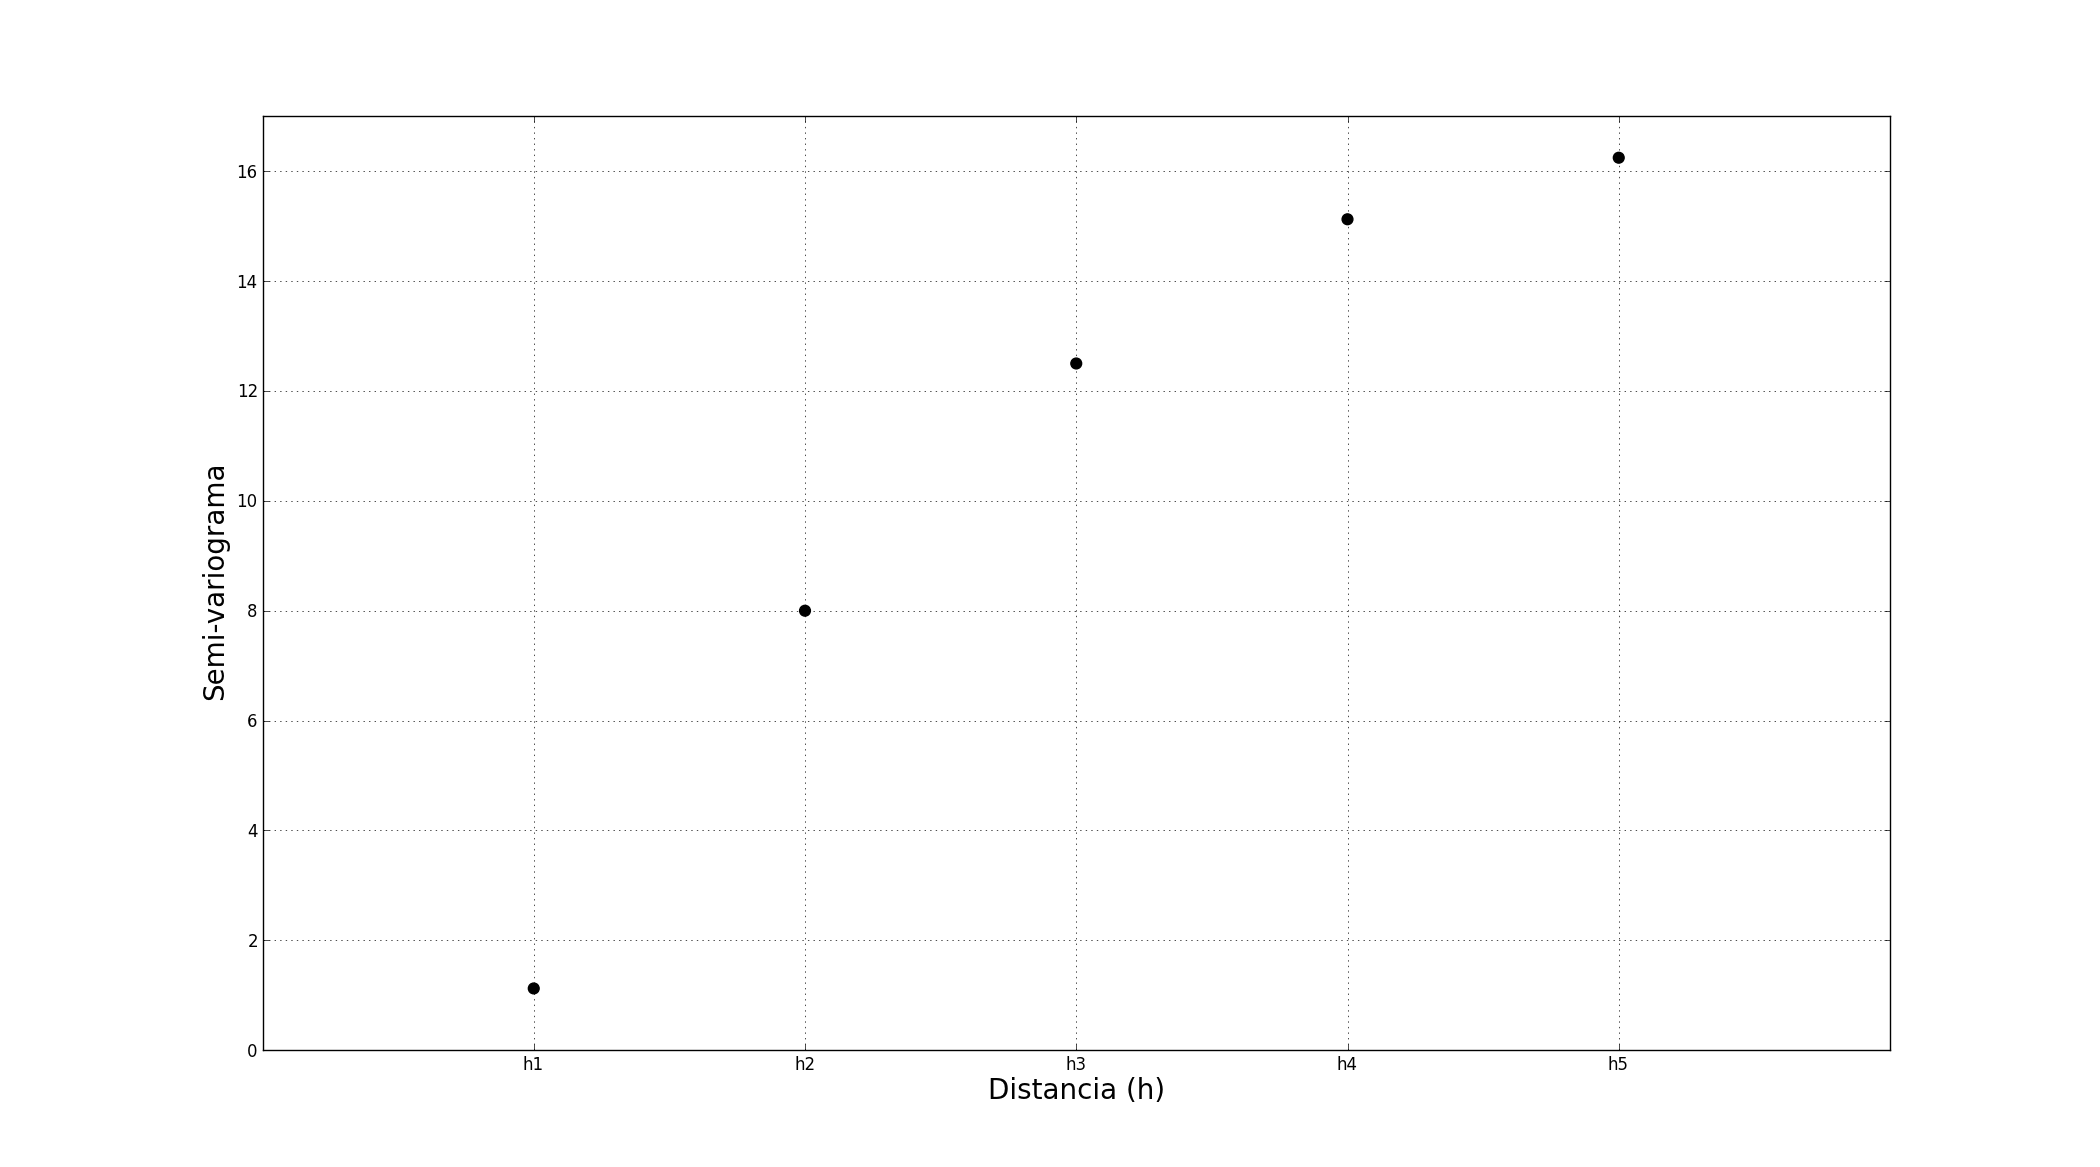
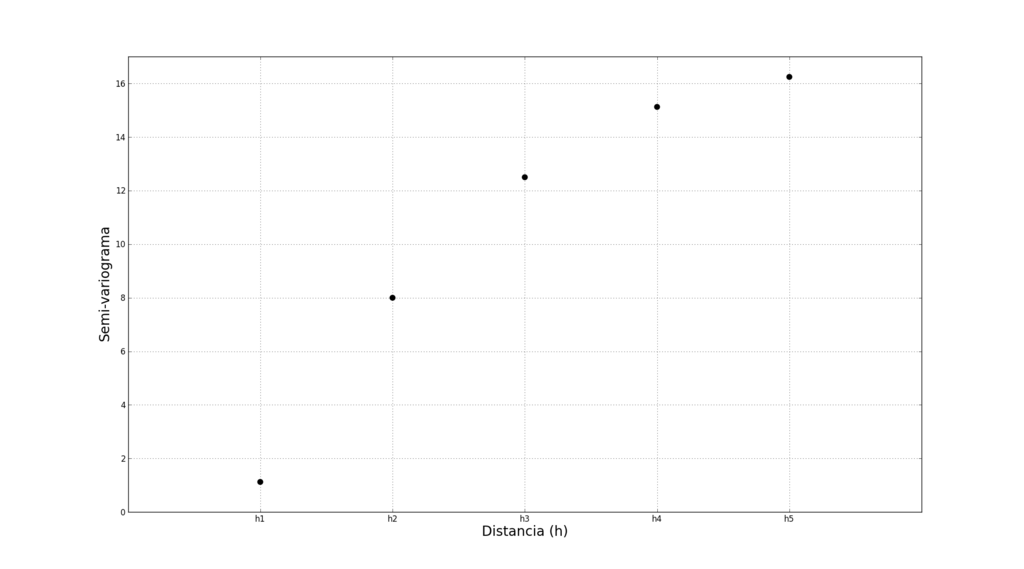
Português: Exemplo de variograma experimental onde uma dada população Z foi re-amostrada para 5 distâncias diferentes (h, eixo x) e calculado o valor de semi-variograma para cada uma das distâncias (eixo y). O resultado é a visualização do variação da amostragem quanto maior a distância a que se encontra.
English: Example of semi-variogram where a given population Z was resampled for five different distances (h, in X axis) e calculated the semi-variogram value for each of the distances (in Y axis). The result is the visualization of the variation of the population when considering spatial distance. |
| Date | |
| Source | Own work |
| Author | Pedro Correia |
Licensing
edit
| I, the copyright holder of this work, release this work into the public domain. This applies worldwide. In some countries this may not be legally possible; if so: I grant anyone the right to use this work for any purpose, without any conditions, unless such conditions are required by law. |
File history
Click on a date/time to view the file as it appeared at that time.
| Date/Time | Thumbnail | Dimensions | User | Comment | |
|---|---|---|---|---|---|
| current | 22:45, 13 December 2011 | | 2,100 × 1,167 (43 KB) | Pedro Pinto Correia (talk | contribs) | {{Information |Description ={{pt|1=Exemplo de variograma experimental onde uma dada população Z foi re-amostrada para 5 distâncias diferentes (h, eixo x) e calculado o valor de semi-variograma para cada uma das distâncias (eixo y). O resultado é a |
You cannot overwrite this file.
File usage on Commons
There are no pages that use this file.
File usage on other wikis
The following other wikis use this file:
- Usage on pt.wikipedia.org