File:WHO Covid 2020 Jan-Aug daily C Cuba.pdf

Size of this JPG preview of this PDF file: 800 × 473 pixels. Other resolutions: 320 × 189 pixels | 640 × 378 pixels | 1,024 × 605 pixels | 1,280 × 756 pixels | 3,300 × 1,950 pixels.
Original file (3,300 × 1,950 pixels, file size: 22 KB, MIME type: application/pdf)
Captions
Captions
Add a one-line explanation of what this file represents
Summary
edit| Description |
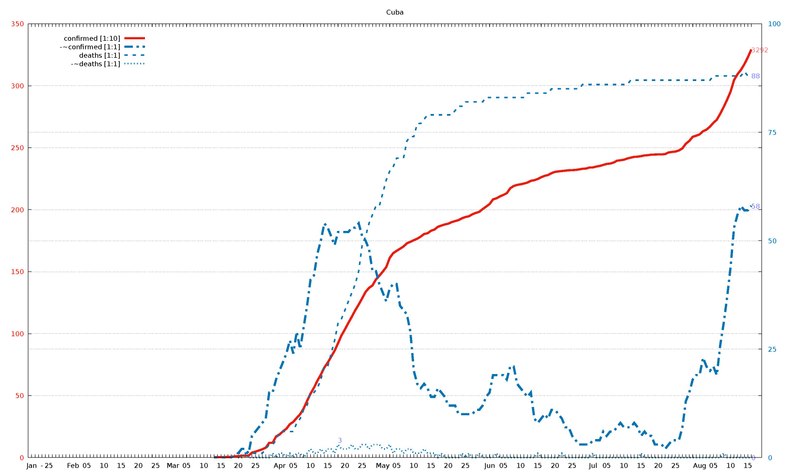
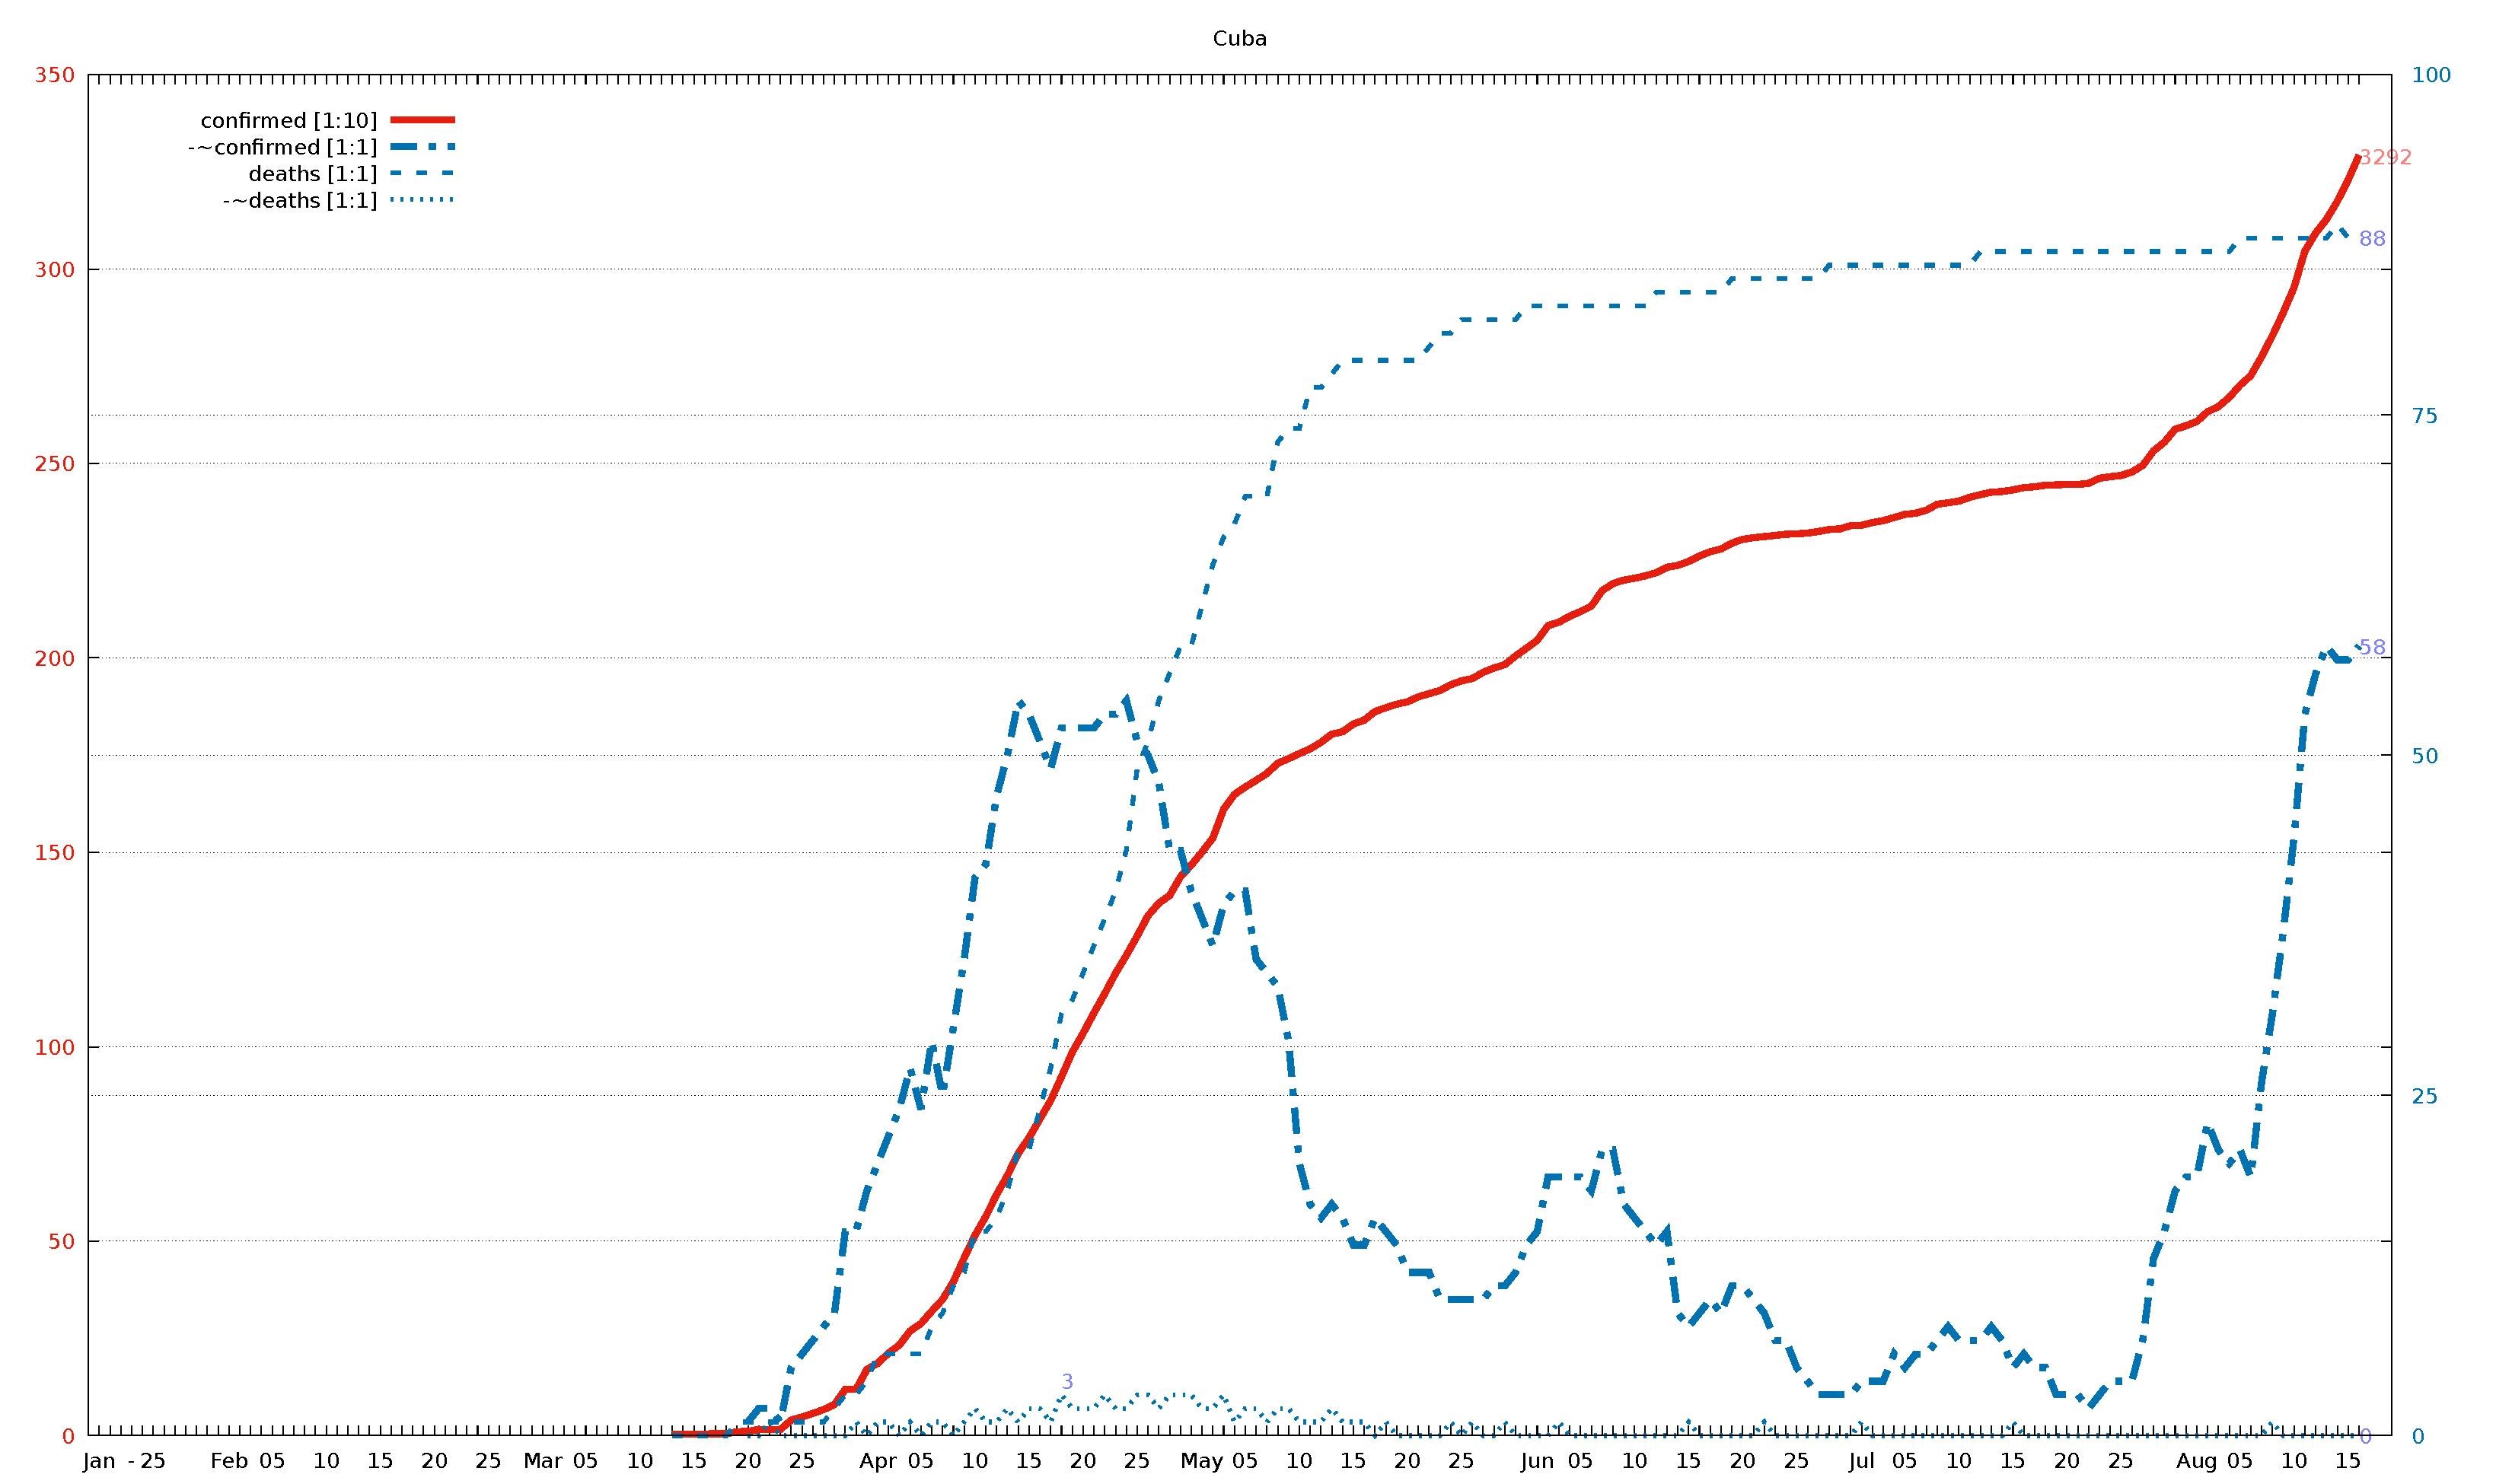
English: Diagram of WHO COVID-19 daily data (20 Jan - 16 Aug 2020) for "Total Confirmed Cases" (thick solid line), its smoothed increment (thick dash-dotted line), "Total Deaths" (thin dashed line) , and its smoothed increment (thin dotted line). Figures are taken from the available situation reports. Red and blue lines refer to the left and right vertical axis, respectively; the scaling factor for each curve is given in the legend. The horizontal axis starts on 20 Jan 2020 (situation report 1), and ends on 16 Aug 2020 (situation report 209). In the smoothed curves, for each day, 1/7 of the difference of the current day's figure and the figure a week ago is shown. For example, in situation report 115 (14 May 2020) and 121 (21 May 2020), there were 8676 and 5339 Total Confirmed Cases in Afghanistan, respectively, so the thick dash-dotted line passes through 477 = (8676-5339)/7 on 21 May.
For an overview of all related visualizations, and a more detailled description, see WHO Covid diagram set#Available country diagrams Jan-Aug 2020 (daily). |
| Date | |
| Source | Own work |
| Author | Jochen Burghardt |
Licensing
editI, the copyright holder of this work, hereby publish it under the following license:
This file is licensed under the Creative Commons Attribution-Share Alike 4.0 International license.
- You are free:
- to share – to copy, distribute and transmit the work
- to remix – to adapt the work
- Under the following conditions:
- attribution – You must give appropriate credit, provide a link to the license, and indicate if changes were made. You may do so in any reasonable manner, but not in any way that suggests the licensor endorses you or your use.
- share alike – If you remix, transform, or build upon the material, you must distribute your contributions under the same or compatible license as the original.
Gnuplot source code
edit| Gnuplot source code |
|---|
set term pdf size 22,13
set term pdf font "sans,20"
set output "WHO_Covid_C_Cuba.pdf"
set key autotitle columnhead
set termoption noenhanced
# (1) norm: 330 001 001 001

set xrange [-1:212]
set yrange [0:350]
set y2range [0:100]
set xtics 3650,100
set ytics 50 textcolor "#e51e10"
set y2tics 25 textcolor "#0072b2"
set grid y y2

set title "Cuba"

$data <<EOF
rep day "confirmed [1:10]" "-~confirmed [1:1]" "deaths [1:1]" "-~deaths [1:1]"
1	Jan	.	-	.	-
2	""	.	-	.	-
3	""	.	-	.	-
-	-	-	-	-	-
4	""	.	-	.	-
5	25	.	-	.	-
6	""	.	-	.	-
7	""	.	-	.	-
8	""	.	-	.	-
9	""	.	-	.	-
10	""	.	-	.	-
11	""	.	-	.	-
12	Feb	.	-	.	-
13	""	.	-	.	-
14	""	.	-	.	-
15	""	.	-	.	-
16	05	.	-	.	-
17	""	.	-	.	-
18	""	.	-	.	-
19	""	.	-	.	-
20	""	.	-	.	-
21	10	.	-	.	-
22	""	.	-	.	-
23	""	.	-	.	-
24	""	.	-	.	-
25	""	.	-	.	-
26	15	.	-	.	-
27	""	.	-	.	-
28	""	.	-	.	-
29	""	.	-	.	-
30	""	.	-	.	-
31	20	.	-	.	-
32	""	.	-	.	-
33	""	.	-	.	-
34	""	.	-	.	-
35	""	.	-	.	-
36	25	.	-	.	-
37	""	.	-	.	-
38	""	.	-	.	-
39	""	.	-	.	-
40	""	.	-	.	-
41	Mar	.	-	.	-
42	""	.	-	.	-
43	""	.	-	.	-
44	""	.	-	.	-
45	05	.	-	.	-
46	""	.	-	.	-
47	""	.	-	.	-
48	""	.	-	.	-
49	""	.	-	.	-
50	10	.	-	.	-
51	""	.	-	.	-
52	""	.	-	.	-
53	""	3	-	0	-
54	""	4	-	0	-
55	15	4	-	0	-
56	""	4	-	0	-
57	""	5	-	0	-
58	""	5	-	0	-
59	""	10	-	1	-
60	20	11	1	1	0
61	""	16	2	1	0
62	""	16	2	1	1
63	""	16	1	1	0
64	""	40	5	1	0
65	25	48	6	1	0
66	""	57	7	1	0
67	""	67	8	1	0
68	""	80	9	2	0
69	""	119	15	3	0
70	""	119	15	3	1
71	""	170	18	4	0
72	Apr	186	20	6	1
73	""	212	22	6	1
74	""	233	24	6	0
75	""	269	27	6	1
76	05	288	24	6	0
77	""	320	29	8	1
78	""	350	25	9	1
79	""	396	30	11	0
80	""	457	35	12	1
81	10	515	41	15	2
82	""	564	42	15	1
83	""	620	47	16	1
84	""	669	50	18	2
85	""	726	54	21	1
86	15	766	53	21	2
87	""	814	51	24	2
88	""	862	49	27	1
89	""	923	52	31	3
90	""	986	52	32	2
91	20	1035	52	34	2
92	""	1087	52	36	2
93	""	1137	53	38	3
94	""	1189	53	40	2
95	""	1235	54	43	2
96	25	1285	51	49	3
97	""	1337	50	51	3
98	""	1369	48	54	2
99	""	1389	43	56	3
100	""	1437	43	58	3
101	""	1467	40	58	3
102	May	1501	38	61	2
103	""	1537	36	64	2
104	""	1611	39	66	3
105	""	1649	40	67	1
106	05	1668	40	69	2
107	""	1685	35	69	2
108	""	1703	34	69	1
109	""	1729	33	73	2
110	""	1741	29	74	2
111	10	1754	20	74	1
112	""	1766	17	77	1
113	""	1783	16	77	1
114	""	1804	17	78	2
115	""	1810	16	79	1
116	15	1830	14	79	1
117	""	1840	14	79	1
118	""	1862	16	79	0
119	""	1872	15	79	1
120	""	1881	14	79	0
121	20	1887	12	79	0
122	""	1900	12	79	0
123	""	1908	12	80	0
124	""	1916	10	81	0
125	""	1931	10	81	1
126	25	1941	10	82	0
127	""	1947	10	82	1
128	""	1963	10	82	0
129	""	1974	11	82	0
130	""	1983	11	82	1
131	""	2005	12	82	0
132	""	2025	14	83	0
133	Jun	2045	15	83	0
134	""	2083	19	83	0
135	""	2092	19	83	1
136	""	2107	19	83	0
137	05	2119	19	83	0
138	""	2133	18	83	0
139	""	2173	21	83	0
140	""	2191	21	83	0
141	""	2200	17	83	0
142	10	2205	16	83	0
143	""	2211	15	83	0
144	""	2219	14	84	0
145	""	2233	15	84	0
146	""	2238	9	84	0
147	15	2248	8	84	1
148	""	2262	9	84	0
149	""	2273	10	84	0
150	""	2280	9	84	0
151	""	2295	11	85	0
152	20	2305	11	85	0
153	""	2309	10	85	0
154	""	2312	9	85	1
155	""	2315	7	85	0
156	""	2318	7	85	0
157	25	2319	5	85	0
158	""	2321	4	85	0
159	""	2325	3	85	0
160	""	2330	3	86	0
161	""	2332	3	86	0
162	""	2340	3	86	0
163	Jul	2341	4	86	1
164	""	2348	4	86	0
165	""	2353	4	86	0
166	""	2361	6	86	0
167	05	2369	5	86	0
168	""	2372	6	86	0
169	""	2380	6	86	0
170	""	2395	7	86	0
171	""	2399	8	86	0
172	10	2403	7	86	0
173	""	2413	7	86	0
174	""	2420	7	87	0
175	""	2426	8	87	0
176	""	2428	7	87	0
177	15	2432	5	87	1
178	""	2438	6	87	0
179	""	2440	5	87	0
180	""	2444	5	87	0
181	""	2445	3	87	0
182	20	2446	3	87	0
183	""	2446	3	87	0
184	""	2449	2	87	0
185	""	2462	3	87	0
186	""	2466	4	87	0
187	25	2469	4	87	0
188	""	2478	4	87	0
189	""	2495	7	87	0
190	""	2532	13	87	0
191	""	2555	15	87	0
192	""	2588	18	87	0
193	""	2597	19	87	0
194	Aug	2608	19	87	0
195	""	2633	23	87	0
196	""	2646	21	87	0
197	""	2670	20	87	0
198	05	2701	21	88	0
199	""	2726	19	88	0
200	""	2775	26	88	0
201	""	2829	31	88	1
202	""	2888	37	88	0
203	10	2953	44	88	0
204	""	3046	53	88	0
205	""	3093	56	88	0
206	""	3128	58	88	0
207	""	3174	57	89	0
208	15	3229	57	88	0
209	""	3292	58	88	0
EOF

# confirmed:
set label "3292   " at first 209,329           left back textcolor "#ff8080"
# -~confirmed:
set label "58     " at first 209, 58*350/100   left back textcolor "#8080ff"
# deaths:
set label "88     " at first 209, 88*350/100   left back textcolor "#8080ff"
# -~deaths:
set label "0      " at first 209,  0*350/100   left back textcolor "#8080ff"
set label "3      " at first  89,  3*350/100+4 left back textcolor "#8080ff"

set multiplot
  plot $data using 0:($3/     10        ) with lines lc 7 lw 8 dt 1 title at 0.150, 0.920
replot $data using 0:($4/      1*350/100) with lines lc 6 lw 8 dt 4 title at 0.150, 0.902
replot $data using 0:($5/      1*350/100) with lines lc 6 lw 5 dt 2 title at 0.150, 0.884
replot $data using 0:($6/      1*350/100) with lines lc 6 lw 5 dt 3 title at 0.150, 0.866

# plot hor axis calendar
replot $data using 0:(0):xticlabel(2) with lines
|
File history
Click on a date/time to view the file as it appeared at that time.
| Date/Time | Thumbnail | Dimensions | User | Comment | |
|---|---|---|---|---|---|
| current | 18:58, 24 September 2020 |  | 3,300 × 1,950 (22 KB) | Jochen Burghardt (talk | contribs) | =={{int:filedesc}}== {{Information |description={{en|1=Diagram of WHO COVID-19 daily data (20 Jan - 16 Aug 2020) for ''"Total Confirmed Cases"'' (thick solid line), its smoothed increment (thick dash-dotted line), ''"Total Deaths"'' (thin dashed line), and its smoothed increment (thin dotted line); see File:WHO_Covid_2020_Jan-Aug_daily_C_Afghanistan.pdf for details.}} |date=2020-09-24 |source={{own}} |author=Jochen Burghardt |permission= |other_versions=[[:File:... |
You cannot overwrite this file.
File usage on Commons
There are no pages that use this file.