File:WHO Covid 2020 Jan-Aug daily C Egypt.pdf

Size of this JPG preview of this PDF file: 800 × 473 pixels. Other resolutions: 320 × 189 pixels | 640 × 378 pixels | 1,024 × 605 pixels | 1,280 × 756 pixels | 3,300 × 1,950 pixels.
Original file (3,300 × 1,950 pixels, file size: 24 KB, MIME type: application/pdf)
Captions
Captions
Add a one-line explanation of what this file represents
Summary
edit| Description |
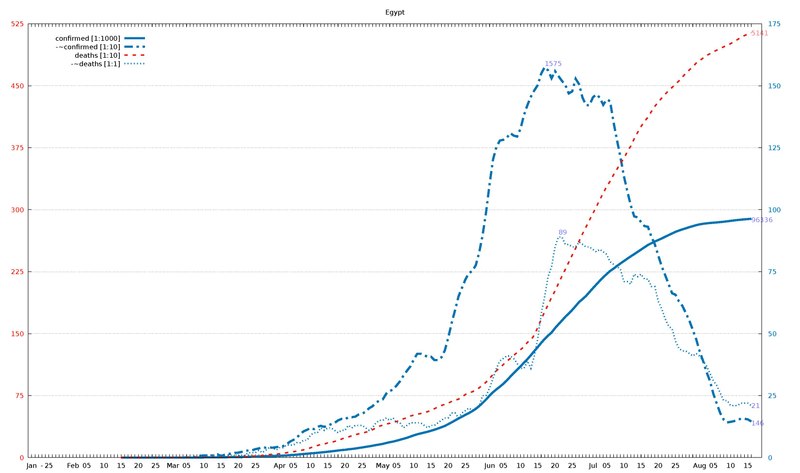
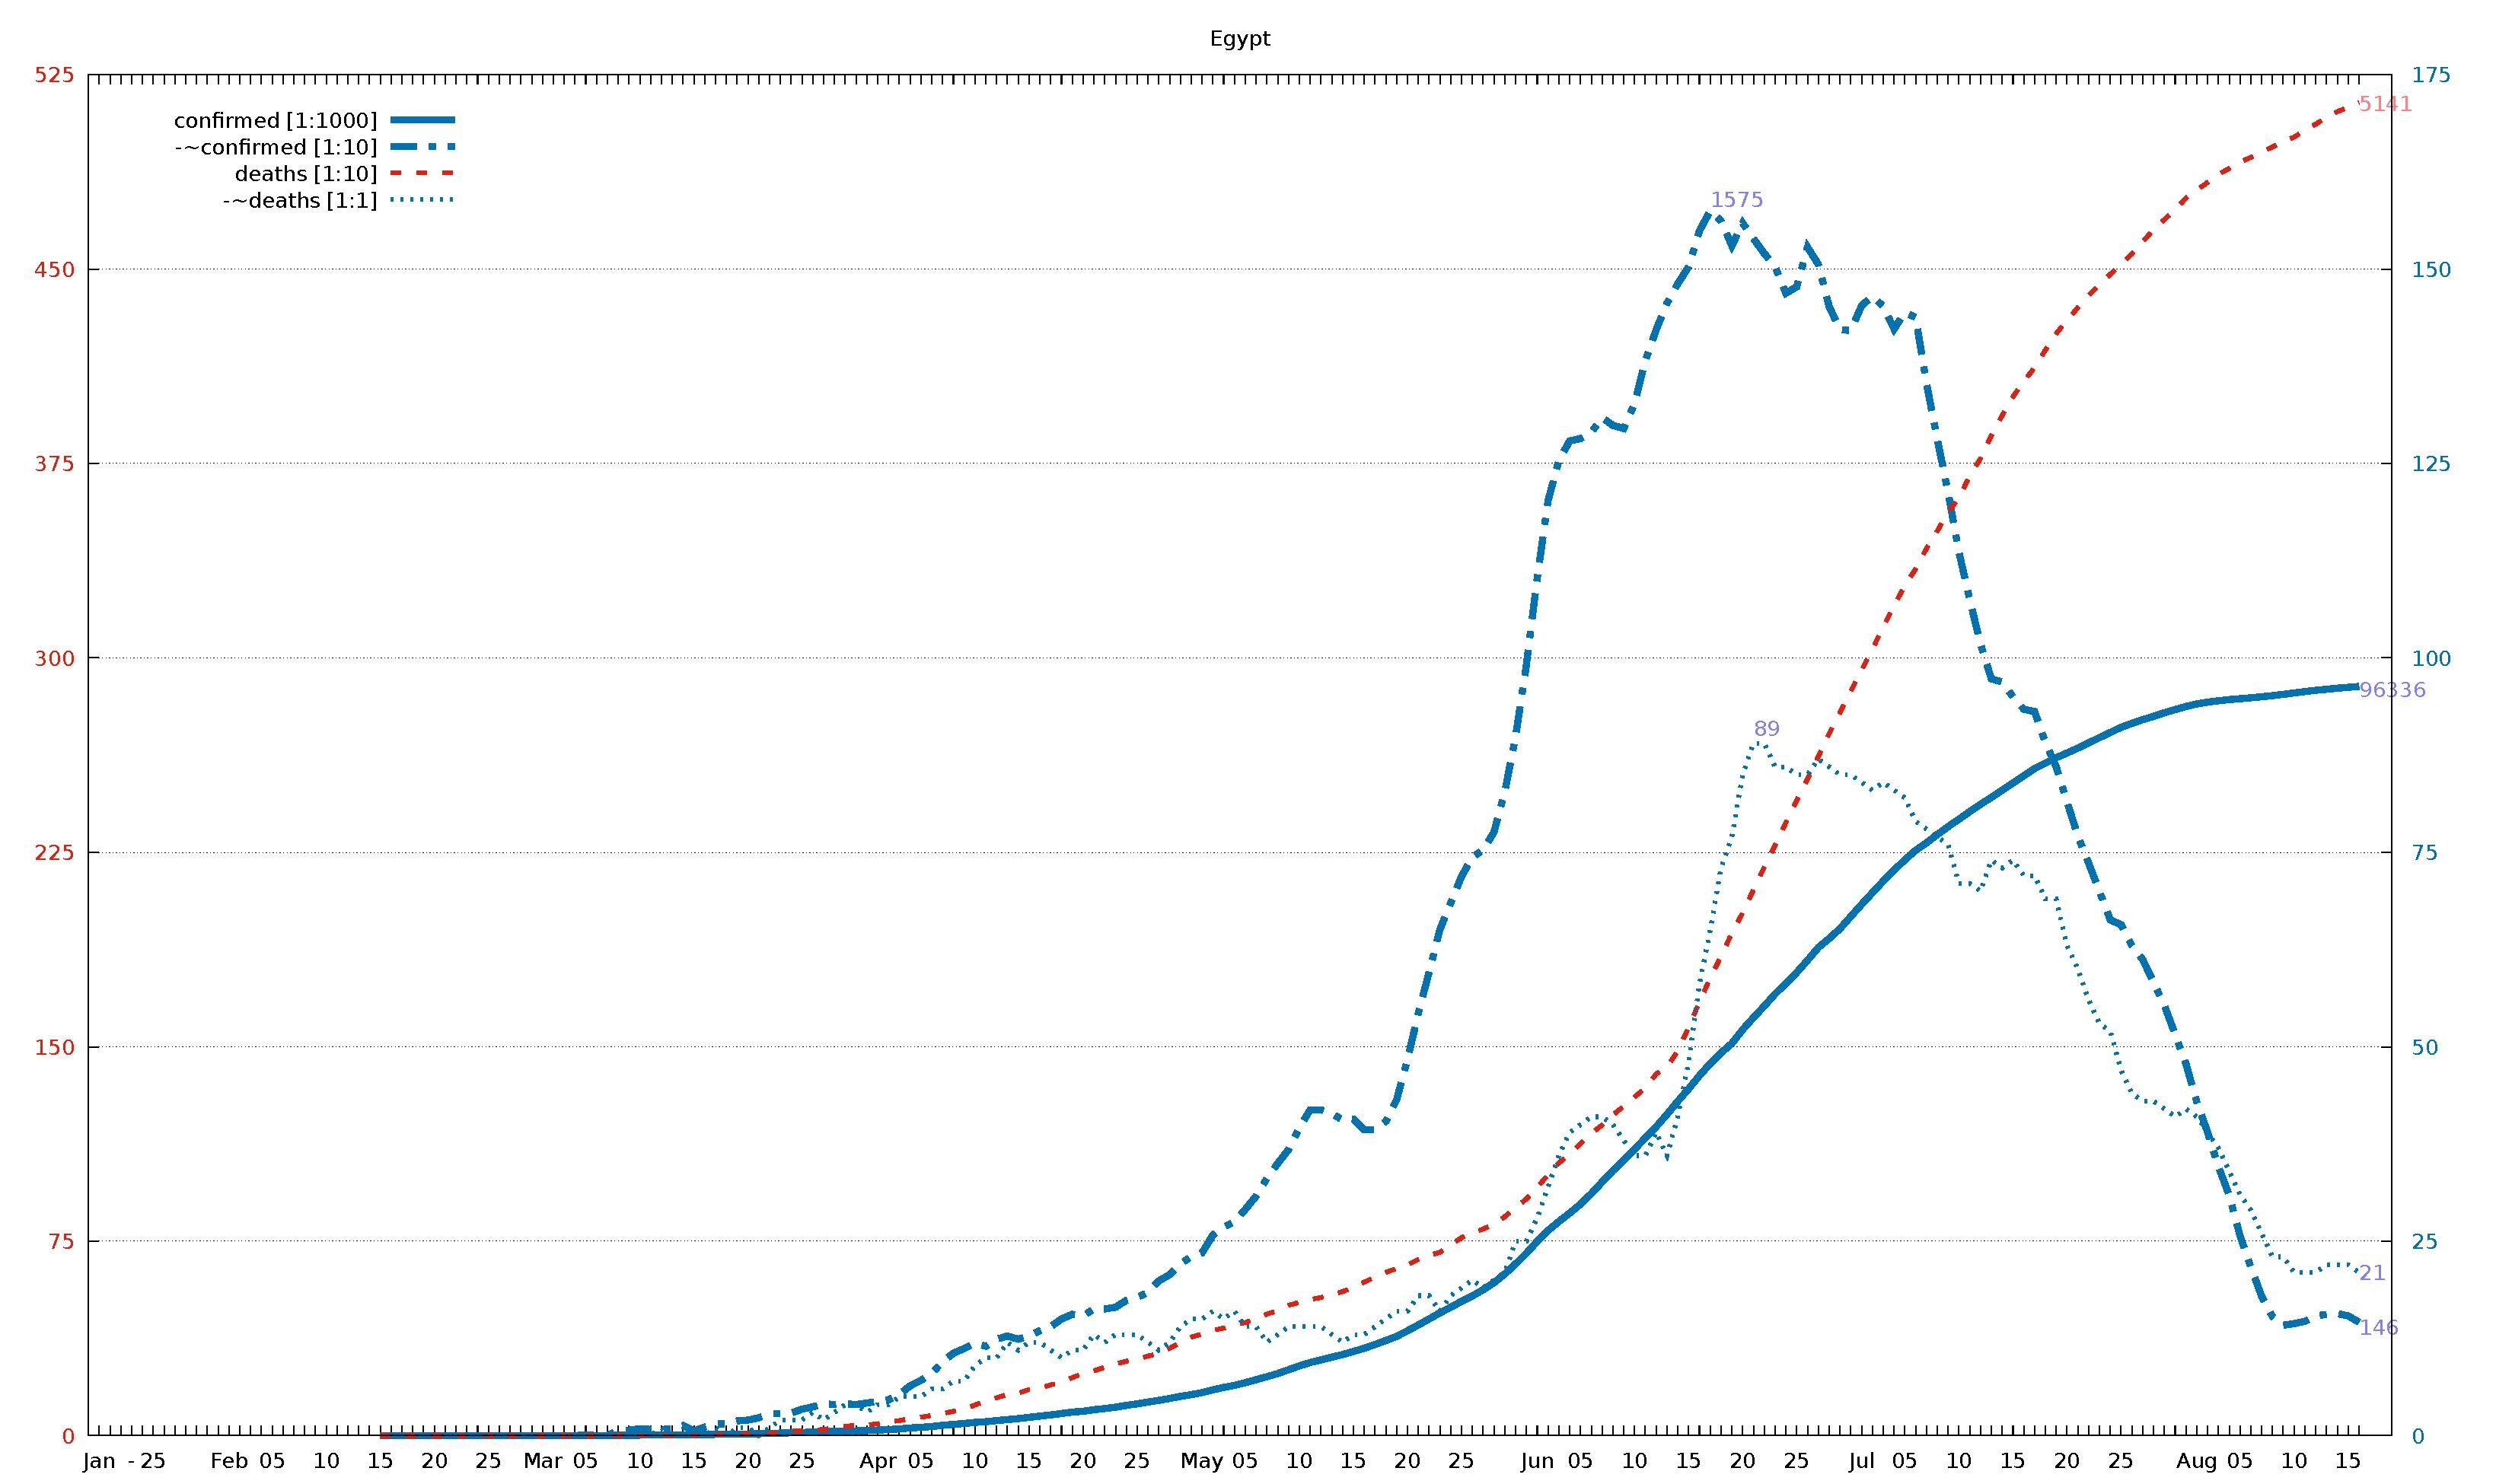
English: Diagram of WHO COVID-19 daily data (20 Jan - 16 Aug 2020) for "Total Confirmed Cases" (thick solid line), its smoothed increment (thick dash-dotted line), "Total Deaths" (thin dashed line) , and its smoothed increment (thin dotted line). Figures are taken from the available situation reports. Red and blue lines refer to the left and right vertical axis, respectively; the scaling factor for each curve is given in the legend. The horizontal axis starts on 20 Jan 2020 (situation report 1), and ends on 16 Aug 2020 (situation report 209). In the smoothed curves, for each day, 1/7 of the difference of the current day's figure and the figure a week ago is shown. For example, in situation report 115 (14 May 2020) and 121 (21 May 2020), there were 8676 and 5339 Total Confirmed Cases in Afghanistan, respectively, so the thick dash-dotted line passes through 477 = (8676-5339)/7 on 21 May.
For an overview of all related visualizations, and a more detailled description, see WHO Covid diagram set#Available country diagrams Jan-Aug 2020 (daily). |
| Date | |
| Source | Own work |
| Author | Jochen Burghardt |
Licensing
editI, the copyright holder of this work, hereby publish it under the following license:
This file is licensed under the Creative Commons Attribution-Share Alike 4.0 International license.
- You are free:
- to share – to copy, distribute and transmit the work
- to remix – to adapt the work
- Under the following conditions:
- attribution – You must give appropriate credit, provide a link to the license, and indicate if changes were made. You may do so in any reasonable manner, but not in any way that suggests the licensor endorses you or your use.
- share alike – If you remix, transform, or build upon the material, you must distribute your contributions under the same or compatible license as the original.
Gnuplot source code
edit| Gnuplot source code |
|---|
set term pdf size 22,13
set term pdf font "sans,20"
set output "WHO_Covid_C_Egypt.pdf"
set key autotitle columnhead
set termoption noenhanced
# (1) norm: 964 158 515 001
# (2) dist: 1,0:163 2,0:188 2,1:306
# (3,4) dist max: 306 2:515--1:158
# (4) right: 1 1 0 1
# (6,7) scMax: 525 175
# (8) scale: [1:1000] [1:10] [1:10] [1:1]


set xrange [-1:212]
set yrange [0:525]
set y2range [0:175]
set xtics 3650,100
set ytics 75 textcolor "#e51e10"
set y2tics 25 textcolor "#0072b2"
set grid y y2

set title "Egypt"

$data <<EOF
rep day "confirmed [1:1000]" "-~confirmed [1:10]" "deaths [1:10]" "-~deaths [1:1]"
1	Jan	.	-	.	-
2	""	.	-	.	-
3	""	.	-	.	-
-	-	-	-	-	-
4	""	.	-	.	-
5	25	.	-	.	-
6	""	.	-	.	-
7	""	.	-	.	-
8	""	.	-	.	-
9	""	.	-	.	-
10	""	.	-	.	-
11	""	.	-	.	-
12	Feb	.	-	.	-
13	""	.	-	.	-
14	""	.	-	.	-
15	""	.	-	.	-
16	05	.	-	.	-
17	""	.	-	.	-
18	""	.	-	.	-
19	""	.	-	.	-
20	""	.	-	.	-
21	10	.	-	.	-
22	""	.	-	.	-
23	""	.	-	.	-
24	""	.	-	.	-
25	""	.	-	.	-
26	15	1	-	0	-
27	""	1	-	0	-
28	""	1	-	0	-
29	""	1	-	0	-
30	""	1	-	0	-
31	20	1	-	0	-
32	""	1	-	0	-
33	""	1	0	0	0
34	""	1	0	0	0
35	""	1	0	0	0
36	25	1	0	0	0
37	""	1	0	0	0
38	""	1	0	0	0
39	""	1	0	0	0
40	""	1	0	0	0
41	Mar	1	0	0	0
42	""	2	0	0	0
43	""	2	0	0	0
44	""	2	0	0	0
45	05	2	1	0	0
46	""	3	0	0	0
47	""	3	0	0	0
48	""	48	7	0	0
49	""	55	7	1	0
50	10	59	9	1	0
51	""	59	8	1	0
52	""	67	9	1	1
53	""	67	9	1	0
54	""	93	13	2	0
55	15	93	6	2	0
56	""	126	11	2	0
57	""	166	15	4	1
58	""	166	15	4	0
59	""	196	19	6	1
60	20	210	20	6	1
61	""	256	23	7	0
62	""	285	28	8	1
63	""	327	28	14	2
64	""	366	29	19	2
65	25	402	34	20	2
66	""	456	37	21	3
67	""	495	41	24	2
68	""	536	40	30	3
69	""	576	41	36	4
70	""	609	40	40	4
71	""	656	42	41	3
72	Apr	710	44	46	4
73	""	779	46	52	4
74	""	865	53	58	5
75	""	985	64	66	5
76	05	1070	71	71	5
77	""	1173	80	78	6
78	""	1322	95	85	6
79	""	1450	106	94	7
80	""	1560	112	103	7
81	10	1699	119	118	9
82	""	1794	115	135	10
83	""	1939	124	146	10
84	""	2065	128	159	12
85	""	2190	124	164	11
86	15	2350	128	178	12
87	""	2505	135	183	12
88	""	2673	140	196	11
89	""	2844	150	205	10
90	""	3032	156	224	11
91	20	3144	154	239	11
92	""	3333	163	250	13
93	""	3490	163	264	12
94	""	3659	165	276	13
95	""	3891	174	287	13
96	25	4092	178	294	13
97	""	4319	184	307	12
98	""	4534	199	317	11
99	""	4782	207	337	12
100	""	5042	221	359	14
101	""	5268	230	380	15
102	May	5537	235	392	15
103	""	5895	258	406	16
104	""	6193	268	415	15
105	""	6465	275	429	16
106	05	6813	291	436	14
107	""	7201	308	452	14
108	""	7588	331	469	12
109	""	7981	350	482	13
110	""	8476	368	503	14
111	10	8964	396	514	14
112	""	9400	419	525	14
113	""	9746	419	533	14
114	""	10093	414	544	13
115	""	10431	406	556	12
116	15	10829	407	571	13
117	""	11228	393	592	13
118	""	11719	393	612	14
119	""	12229	404	630	15
120	""	12764	432	645	16
121	20	13484	484	659	16
122	""	14229	543	680	18
123	""	15003	596	696	18
124	""	15786	651	707	16
125	""	16513	685	735	18
126	25	17265	719	764	19
127	""	17967	744	783	20
128	""	18756	753	797	19
129	""	19666	776	816	20
130	""	20793	828	845	21
131	""	22082	899	879	25
132	""	23449	991	913	25
133	Jun	24985	1103	959	28
134	""	26384	1202	1005	32
135	""	27536	1254	1052	36
136	""	28615	1279	1088	39
137	05	29767	1282	1126	40
138	""	31115	1290	1166	41
139	""	32612	1309	1198	41
140	""	34079	1299	1237	40
141	""	35444	1295	1271	38
142	10	36829	1327	1306	36
143	""	38284	1382	1342	36
144	""	39726	1422	1395	39
145	""	41303	1456	1422	36
146	""	42980	1481	1484	41
147	15	44598	1503	1575	48
148	""	46289	1549	1672	58
149	""	47856	1575	1766	65
150	""	49219	1562	1850	73
151	""	50437	1530	1938	77
152	20	52211	1559	2017	85
153	""	53758	1539	2106	89
154	""	55233	1520	2193	89
155	""	56809	1503	2278	86
156	""	58141	1469	2365	86
157	25	59561	1477	2450	85
158	""	61130	1528	2533	85
159	""	62755	1506	2620	87
160	""	63923	1452	2708	86
161	""	65188	1422	2789	85
162	""	66754	1421	2872	85
163	Jul	68311	1453	2953	84
164	""	69814	1465	3034	83
165	""	71299	1452	3120	84
166	""	72711	1423	3201	83
167	05	74035	1444	3280	82
168	""	75253	1438	3343	79
169	""	76222	1353	3422	78
170	""	77279	1281	3489	77
171	""	78304	1213	3564	76
172	10	79254	1136	3617	71
173	""	80235	1075	3702	71
174	""	81158	1018	3769	70
175	""	82070	973	3858	74
176	""	83001	969	3935	73
177	15	83930	950	4008	74
178	""	84843	934	4067	72
179	""	85771	931	4120	72
180	""	86474	891	4188	69
181	""	87172	860	4251	69
182	20	87775	815	4302	63
183	""	88402	771	4352	60
184	""	89078	736	4399	56
185	""	89745	700	4440	53
186	""	90413	663	4480	52
187	25	91072	657	4518	47
188	""	91583	630	4558	44
189	""	92062	612	4606	43
190	""	92482	583	4652	43
191	""	92947	553	4691	42
192	""	93356	516	4728	41
193	""	93757	478	4774	42
194	Aug	94078	429	4805	41
195	""	94316	390	4834	39
196	""	94483	346	4865	37
197	""	94640	309	4888	34
198	05	94752	257	4912	31
199	""	94875	217	4931	29
200	""	95006	179	4951	26
201	""	95147	153	4971	23
202	""	95314	142	4992	23
203	10	95492	144	5009	21
204	""	95666	147	5035	21
205	""	95834	154	5059	21
206	""	95963	156	5085	22
207	""	96108	157	5107	22
208	15	96220	154	5124	22
209	""	96336	146	5141	21
EOF

# confirmed:
set label "96336  " at first 209, 96*525/175   left back textcolor "#8080ff"
# -~confirmed:
set label "146    " at first 209, 14*525/175   left back textcolor "#8080ff"
set label "1575   " at first 149,157*525/175+6 left back textcolor "#8080ff"
# deaths:
set label "5141   " at first 209,514           left back textcolor "#ff8080"
# -~deaths:
set label "21     " at first 209, 21*525/175   left back textcolor "#8080ff"
set label "89     " at first 153, 89*525/175+6 left back textcolor "#8080ff"

set multiplot
  plot $data using 0:($3/   1000*525/175) with lines lc 6 lw 8 dt 1 title at 0.150, 0.920
replot $data using 0:($4/     10*525/175) with lines lc 6 lw 8 dt 4 title at 0.150, 0.902
replot $data using 0:($5/     10        ) with lines lc 7 lw 5 dt 2 title at 0.150, 0.884
replot $data using 0:($6/      1*525/175) with lines lc 6 lw 5 dt 3 title at 0.150, 0.866

# plot hor axis calendar
replot $data using 0:(0):xticlabel(2) with lines
|
File history
Click on a date/time to view the file as it appeared at that time.
| Date/Time | Thumbnail | Dimensions | User | Comment | |
|---|---|---|---|---|---|
| current | 19:02, 24 September 2020 |  | 3,300 × 1,950 (24 KB) | Jochen Burghardt (talk | contribs) | =={{int:filedesc}}== {{Information |description={{en|1=Diagram of WHO COVID-19 daily data (20 Jan - 16 Aug 2020) for ''"Total Confirmed Cases"'' (thick solid line), its smoothed increment (thick dash-dotted line), ''"Total Deaths"'' (thin dashed line), and its smoothed increment (thin dotted line); see File:WHO_Covid_2020_Jan-Aug_daily_C_Afghanistan.pdf for details.}} |date=2020-09-24 |source={{own}} |author=Jochen Burghardt |permission= |other_versions=[[:File:... |
You cannot overwrite this file.
File usage on Commons
There are no pages that use this file.