File:WHO Covid 2020 Jan-Aug daily C India.pdf

Size of this JPG preview of this PDF file: 800 × 473 pixels. Other resolutions: 320 × 189 pixels | 640 × 378 pixels | 1,024 × 605 pixels | 1,280 × 756 pixels | 3,300 × 1,950 pixels.
Original file (3,300 × 1,950 pixels, file size: 24 KB, MIME type: application/pdf)
Captions
Captions
Add a one-line explanation of what this file represents
Summary
edit| Description |
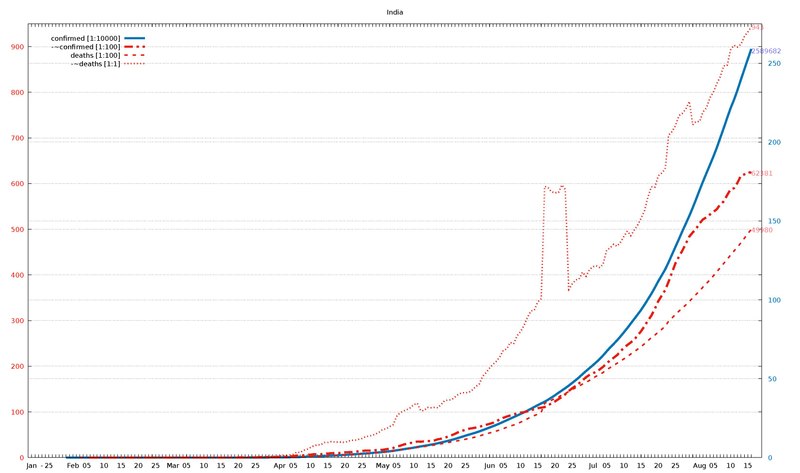
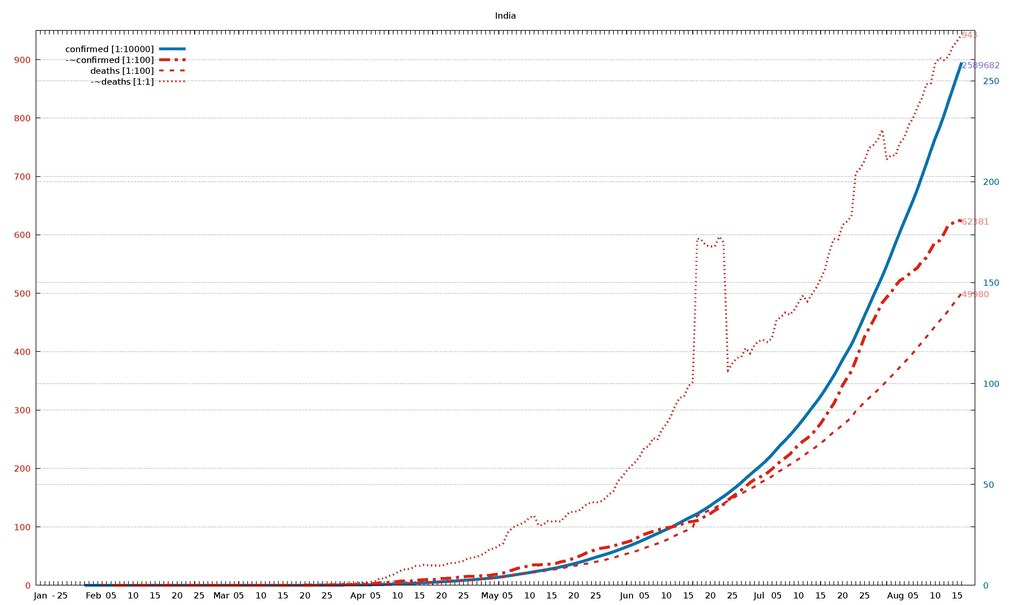
English: Diagram of WHO COVID-19 daily data (20 Jan - 16 Aug 2020) for "Total Confirmed Cases" (thick solid line), its smoothed increment (thick dash-dotted line), "Total Deaths" (thin dashed line) , and its smoothed increment (thin dotted line). Figures are taken from the available situation reports. Red and blue lines refer to the left and right vertical axis, respectively; the scaling factor for each curve is given in the legend. The horizontal axis starts on 20 Jan 2020 (situation report 1), and ends on 16 Aug 2020 (situation report 209). In the smoothed curves, for each day, 1/7 of the difference of the current day's figure and the figure a week ago is shown. For example, in situation report 115 (14 May 2020) and 121 (21 May 2020), there were 8676 and 5339 Total Confirmed Cases in Afghanistan, respectively, so the thick dash-dotted line passes through 477 = (8676-5339)/7 on 21 May.
For an overview of all related visualizations, and a more detailled description, see WHO Covid diagram set#Available country diagrams Jan-Aug 2020 (daily). |
| Date | |
| Source | Own work |
| Author | Jochen Burghardt |
Licensing
editI, the copyright holder of this work, hereby publish it under the following license:
This file is licensed under the Creative Commons Attribution-Share Alike 4.0 International license.
- You are free:
- to share – to copy, distribute and transmit the work
- to remix – to adapt the work
- Under the following conditions:
- attribution – You must give appropriate credit, provide a link to the license, and indicate if changes were made. You may do so in any reasonable manner, but not in any way that suggests the licensor endorses you or your use.
- share alike – If you remix, transform, or build upon the material, you must distribute your contributions under the same or compatible license as the original.
Gnuplot source code
edit| Gnuplot source code |
|---|
set term pdf size 22,13
set term pdf font "sans,20"
set output "WHO_Covid_C_India.pdf"
set key autotitle columnhead
set termoption noenhanced
# (1) norm: 259 626 500 943
# (2) dist: 1,0:242 2,0:193 2,1:126 3,0:274 3,1:151 3,2:189
# (3,4) dist max: 274 3:943--0:259
# (4) right: 1 0 0 0
# (6,7) scMax: 950 275
# (8) scale: [1:10000] [1:100] [1:100] [1:1]


set xrange [-1:212]
set yrange [0:950]
set y2range [0:275]
set xtics 3650,100
set ytics 100 textcolor "#e51e10"
set y2tics 50 textcolor "#0072b2"
set grid y y2

set title "India"

$data <<EOF
rep day "confirmed [1:10000]" "-~confirmed [1:100]" "deaths [1:100]" "-~deaths [1:1]"
1	Jan	.	-	.	-
2	""	.	-	.	-
3	""	.	-	.	-
-	-	-	-	-	-
4	""	.	-	.	-
5	25	.	-	.	-
6	""	.	-	.	-
7	""	.	-	.	-
8	""	.	-	.	-
9	""	.	-	.	-
10	""	1	-	.	-
11	""	1	-	.	-
12	Feb	1	-	.	-
13	""	2	-	.	-
14	""	3	-	0	-
15	""	3	-	0	-
16	05	3	-	0	-
17	""	3	0	0	-
18	""	3	1	0	-
19	""	3	0	0	-
20	""	3	0	0	-
21	10	3	0	0	0
22	""	3	0	0	0
23	""	3	0	0	0
24	""	3	0	0	0
25	""	3	0	0	0
26	15	3	0	0	0
27	""	3	0	0	0
28	""	3	0	0	0
29	""	3	0	0	0
30	""	3	0	0	0
31	20	3	0	0	0
32	""	3	0	0	0
33	""	3	0	0	0
34	""	3	0	0	0
35	""	3	0	0	0
36	25	3	0	0	0
37	""	3	0	0	0
38	""	3	0	0	0
39	""	3	0	0	0
40	""	3	0	0	0
41	Mar	3	0	0	0
42	""	3	0	0	0
43	""	5	0	0	0
44	""	6	1	0	0
45	05	29	3	0	0
46	""	30	4	0	0
47	""	31	4	0	0
48	""	34	5	0	0
49	""	43	5	0	0
50	10	44	6	0	0
51	""	60	8	0	0
52	""	73	6	0	0
53	""	74	6	1	0
54	""	82	8	2	0
55	15	107	10	2	1
56	""	114	10	2	0
57	""	137	13	3	0
58	""	137	11	3	1
59	""	151	12	3	0
60	20	195	17	4	1
61	""	195	16	4	0
62	""	283	25	4	0
63	""	415	43	7	1
64	""	434	43	9	1
65	25	562	60	9	1
66	""	649	71	13	1
67	""	724	76	17	2
68	""	724	76	17	2
69	""	979	99	25	3
70	""	1071	94	29	3
71	""	1071	91	29	3
72	Apr	1636	153	38	4
73	""	1636	141	38	4
74	""	1965	177	50	4
75	""	2301	226	56	6
76	05	3374	342	77	7
77	""	4067	428	109	12
78	""	4067	428	109	11
79	""	5194	508	149	16
80	""	5734	586	166	18
81	10	6412	635	199	22
82	""	7447	735	239	26
83	""	8356	712	273	28
84	""	9152	726	308	28
85	""	10363	900	339	33
86	15	11439	892	377	33
87	""	12380	949	414	35
88	""	13387	997	437	34
89	""	14378	990	480	34
90	""	15712	1051	507	34
91	20	17265	1159	543	33
92	""	18601	1176	590	36
93	""	19984	1221	640	38
94	""	21393	1288	681	38
95	""	23077	1384	718	40
96	25	24506	1447	775	42
97	""	26496	1540	824	46
98	""	27892	1519	872	47
99	""	29435	1547	934	49
100	""	31332	1621	1007	52
101	""	33050	1666	1074	56
102	May	35043	1709	1147	62
103	""	37336	1833	1218	63
104	""	39980	1926	1301	68
105	""	42533	2092	1373	72
106	05	46433	2428	1568	90
107	""	49391	2580	1694	98
108	""	52952	2843	1783	102
109	""	56342	3043	1886	105
110	""	59662	3189	1981	109
111	10	62939	3280	2109	116
112	""	67152	3517	2206	119
113	""	70756	3475	2293	103
114	""	74281	3556	2415	103
115	""	78003	3578	2549	110
116	15	81970	3661	2649	109
117	""	85940	3754	2752	110
118	""	90927	3999	2872	109
119	""	96169	4145	3029	117
120	""	101139	4340	3163	125
121	20	106750	4639	3303	126
122	""	112359	4908	3435	127
123	""	118447	5211	3583	133
124	""	125101	5594	3720	139
125	""	131868	5849	3867	142
126	25	138845	6097	4021	142
127	""	145380	6320	4167	143
128	""	151767	6431	4337	148
129	""	158333	6567	4531	156
130	""	165799	6765	4706	161
131	""	173763	6952	4971	178
132	""	182143	7182	5164	186
133	Jun	190535	7384	5394	196
134	""	198706	7618	5598	204
135	""	207615	7978	5815	211
136	""	216919	8370	6075	221
137	05	226770	8710	6348	235
138	""	236657	8985	6642	238
139	""	246628	9212	6929	252
140	""	256611	9439	7135	249
141	""	266598	9699	7466	267
142	10	276583	9853	7745	276
143	""	286579	9951	8102	289
144	""	297535	10110	8498	307
145	""	308993	10333	8884	321
146	""	320922	10614	9195	323
147	15	332424	10830	9520	341
148	""	343091	10928	9900	348
149	""	354065	11069	11903	594
150	""	366946	11481	12237	591
151	""	380532	11856	12573	582
152	20	395048	12294	12948	580
153	""	410461	12791	13254	580
154	""	425282	13266	13699	597
155	""	440215	13874	14011	587
156	""	456183	14589	14476	368
157	25	473105	15165	14894	380
158	""	490401	15696	15301	389
159	""	508953	16272	15685	391
160	""	528859	16914	16095	406
161	""	548318	17577	16475	397
162	""	566840	18089	16893	411
163	Jul	585493	18473	17400	418
164	""	604641	18791	17834	420
165	""	625544	19306	18213	416
166	""	648315	19909	18655	424
167	05	673165	20615	19268	454
168	""	697413	21299	19693	459
169	""	719665	21832	20160	467
170	""	742417	22418	20642	463
171	""	767296	23236	21129	471
172	10	793802	24037	21604	484
173	""	820916	24657	22123	496
174	""	849553	25199	22674	486
175	""	878254	25834	23174	498
176	""	906752	26727	23727	509
177	15	936181	27680	24309	524
178	""	968876	28798	24915	541
179	""	1003832	30004	25602	571
180	""	1038716	31114	26273	593
181	""	1077618	32581	26816	592
182	20	1118043	34255	27497	617
183	""	1155191	35492	28084	623
184	""	1192915	36676	28732	632
185	""	1238635	38537	29861	706
186	""	1287945	40588	30601	714
187	25	1336861	42592	31358	727
188	""	1385522	43986	32063	749
189	""	1435453	45344	32771	754
190	""	1483156	46852	33425	763
191	""	1531669	48394	34193	780
192	""	1583792	49308	34968	729
193	""	1638870	50132	35747	736
194	Aug	1695988	51304	36511	736
195	""	1750723	52172	37364	757
196	""	1803695	52606	38135	766
197	""	1855745	53227	38938	788
198	05	1908254	53797	39795	800
199	""	1964536	54392	40699	819
200	""	2027074	55458	41585	834
201	""	2088611	56089	42518	858
202	""	2153010	57470	43379	859
203	10	2215074	58768	44386	893
204	""	2268675	58990	45257	903
205	""	2329638	60198	46091	899
206	""	2396637	61729	47033	905
207	""	2461190	62016	48040	922
208	15	2526192	62512	49036	932
209	""	2589682	62381	49980	943
EOF

# confirmed:
set label "2589682" at first 209,258*950/275   left back textcolor "#8080ff"
# -~confirmed:
set label "62381  " at first 209,623           left back textcolor "#ff8080"
# deaths:
set label "49980  " at first 209,499           left back textcolor "#ff8080"
# -~deaths:
set label "943    " at first 209,943           left back textcolor "#ff8080"

set multiplot
  plot $data using 0:($3/  10000*950/275) with lines lc 6 lw 8 dt 1 title at 0.150, 0.920
replot $data using 0:($4/    100        ) with lines lc 7 lw 8 dt 4 title at 0.150, 0.902
replot $data using 0:($5/    100        ) with lines lc 7 lw 5 dt 2 title at 0.150, 0.884
replot $data using 0:($6/      1        ) with lines lc 7 lw 5 dt 3 title at 0.150, 0.866

# plot hor axis calendar
replot $data using 0:(0):xticlabel(2) with lines
|
File history
Click on a date/time to view the file as it appeared at that time.
| Date/Time | Thumbnail | Dimensions | User | Comment | |
|---|---|---|---|---|---|
| current | 19:12, 24 September 2020 |  | 3,300 × 1,950 (24 KB) | Jochen Burghardt (talk | contribs) | =={{int:filedesc}}== {{Information |description={{en|1=Diagram of WHO COVID-19 daily data (20 Jan - 16 Aug 2020) for ''"Total Confirmed Cases"'' (thick solid line), its smoothed increment (thick dash-dotted line), ''"Total Deaths"'' (thin dashed line), and its smoothed increment (thin dotted line); see File:WHO_Covid_2020_Jan-Aug_daily_C_Afghanistan.pdf for details.}} |date=2020-09-24 |source={{own}} |author=Jochen Burghardt |permission= |other_versions=[[:File:... |
You cannot overwrite this file.
File usage on Commons
There are no pages that use this file.