File:WHO Covid 2020 Jan-Aug daily C Malaysia.pdf

Size of this JPG preview of this PDF file: 800 × 473 pixels. Other resolutions: 320 × 189 pixels | 640 × 378 pixels | 1,024 × 605 pixels | 1,280 × 756 pixels | 3,300 × 1,950 pixels.
Original file (3,300 × 1,950 pixels, file size: 23 KB, MIME type: application/pdf)
Captions
Captions
Add a one-line explanation of what this file represents
Summary
edit| Description |
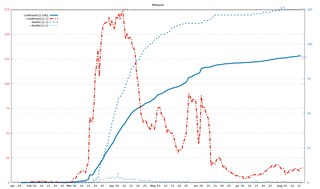
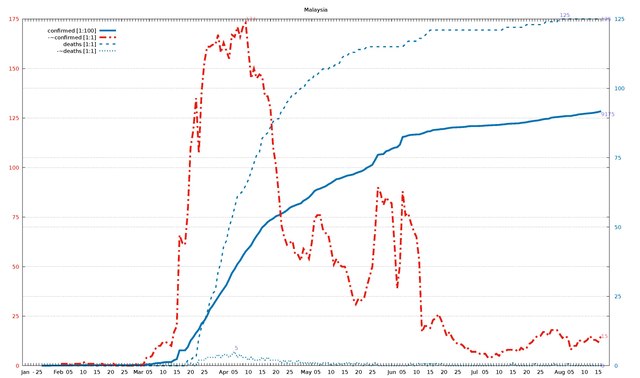
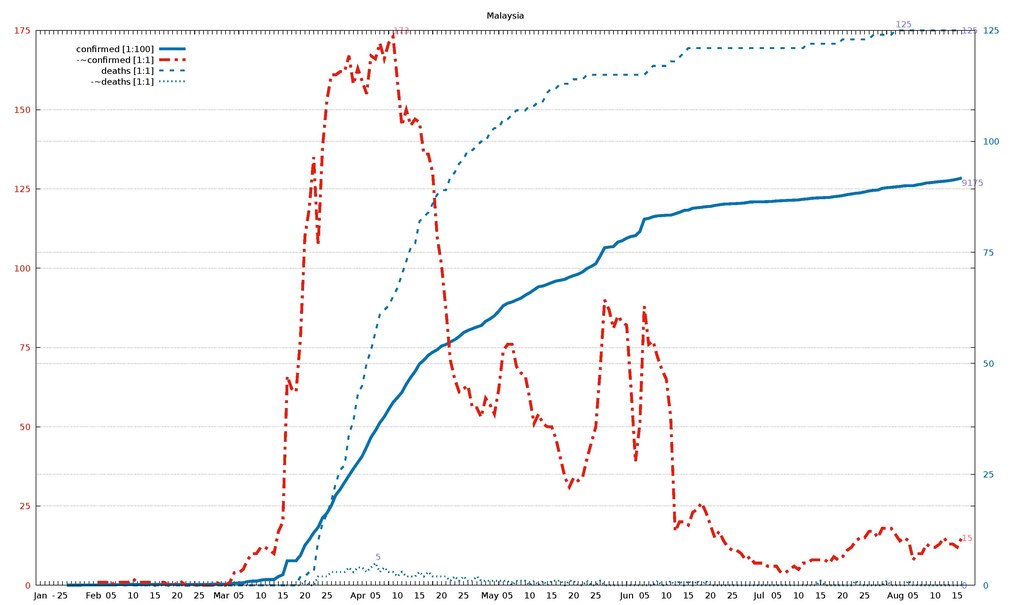
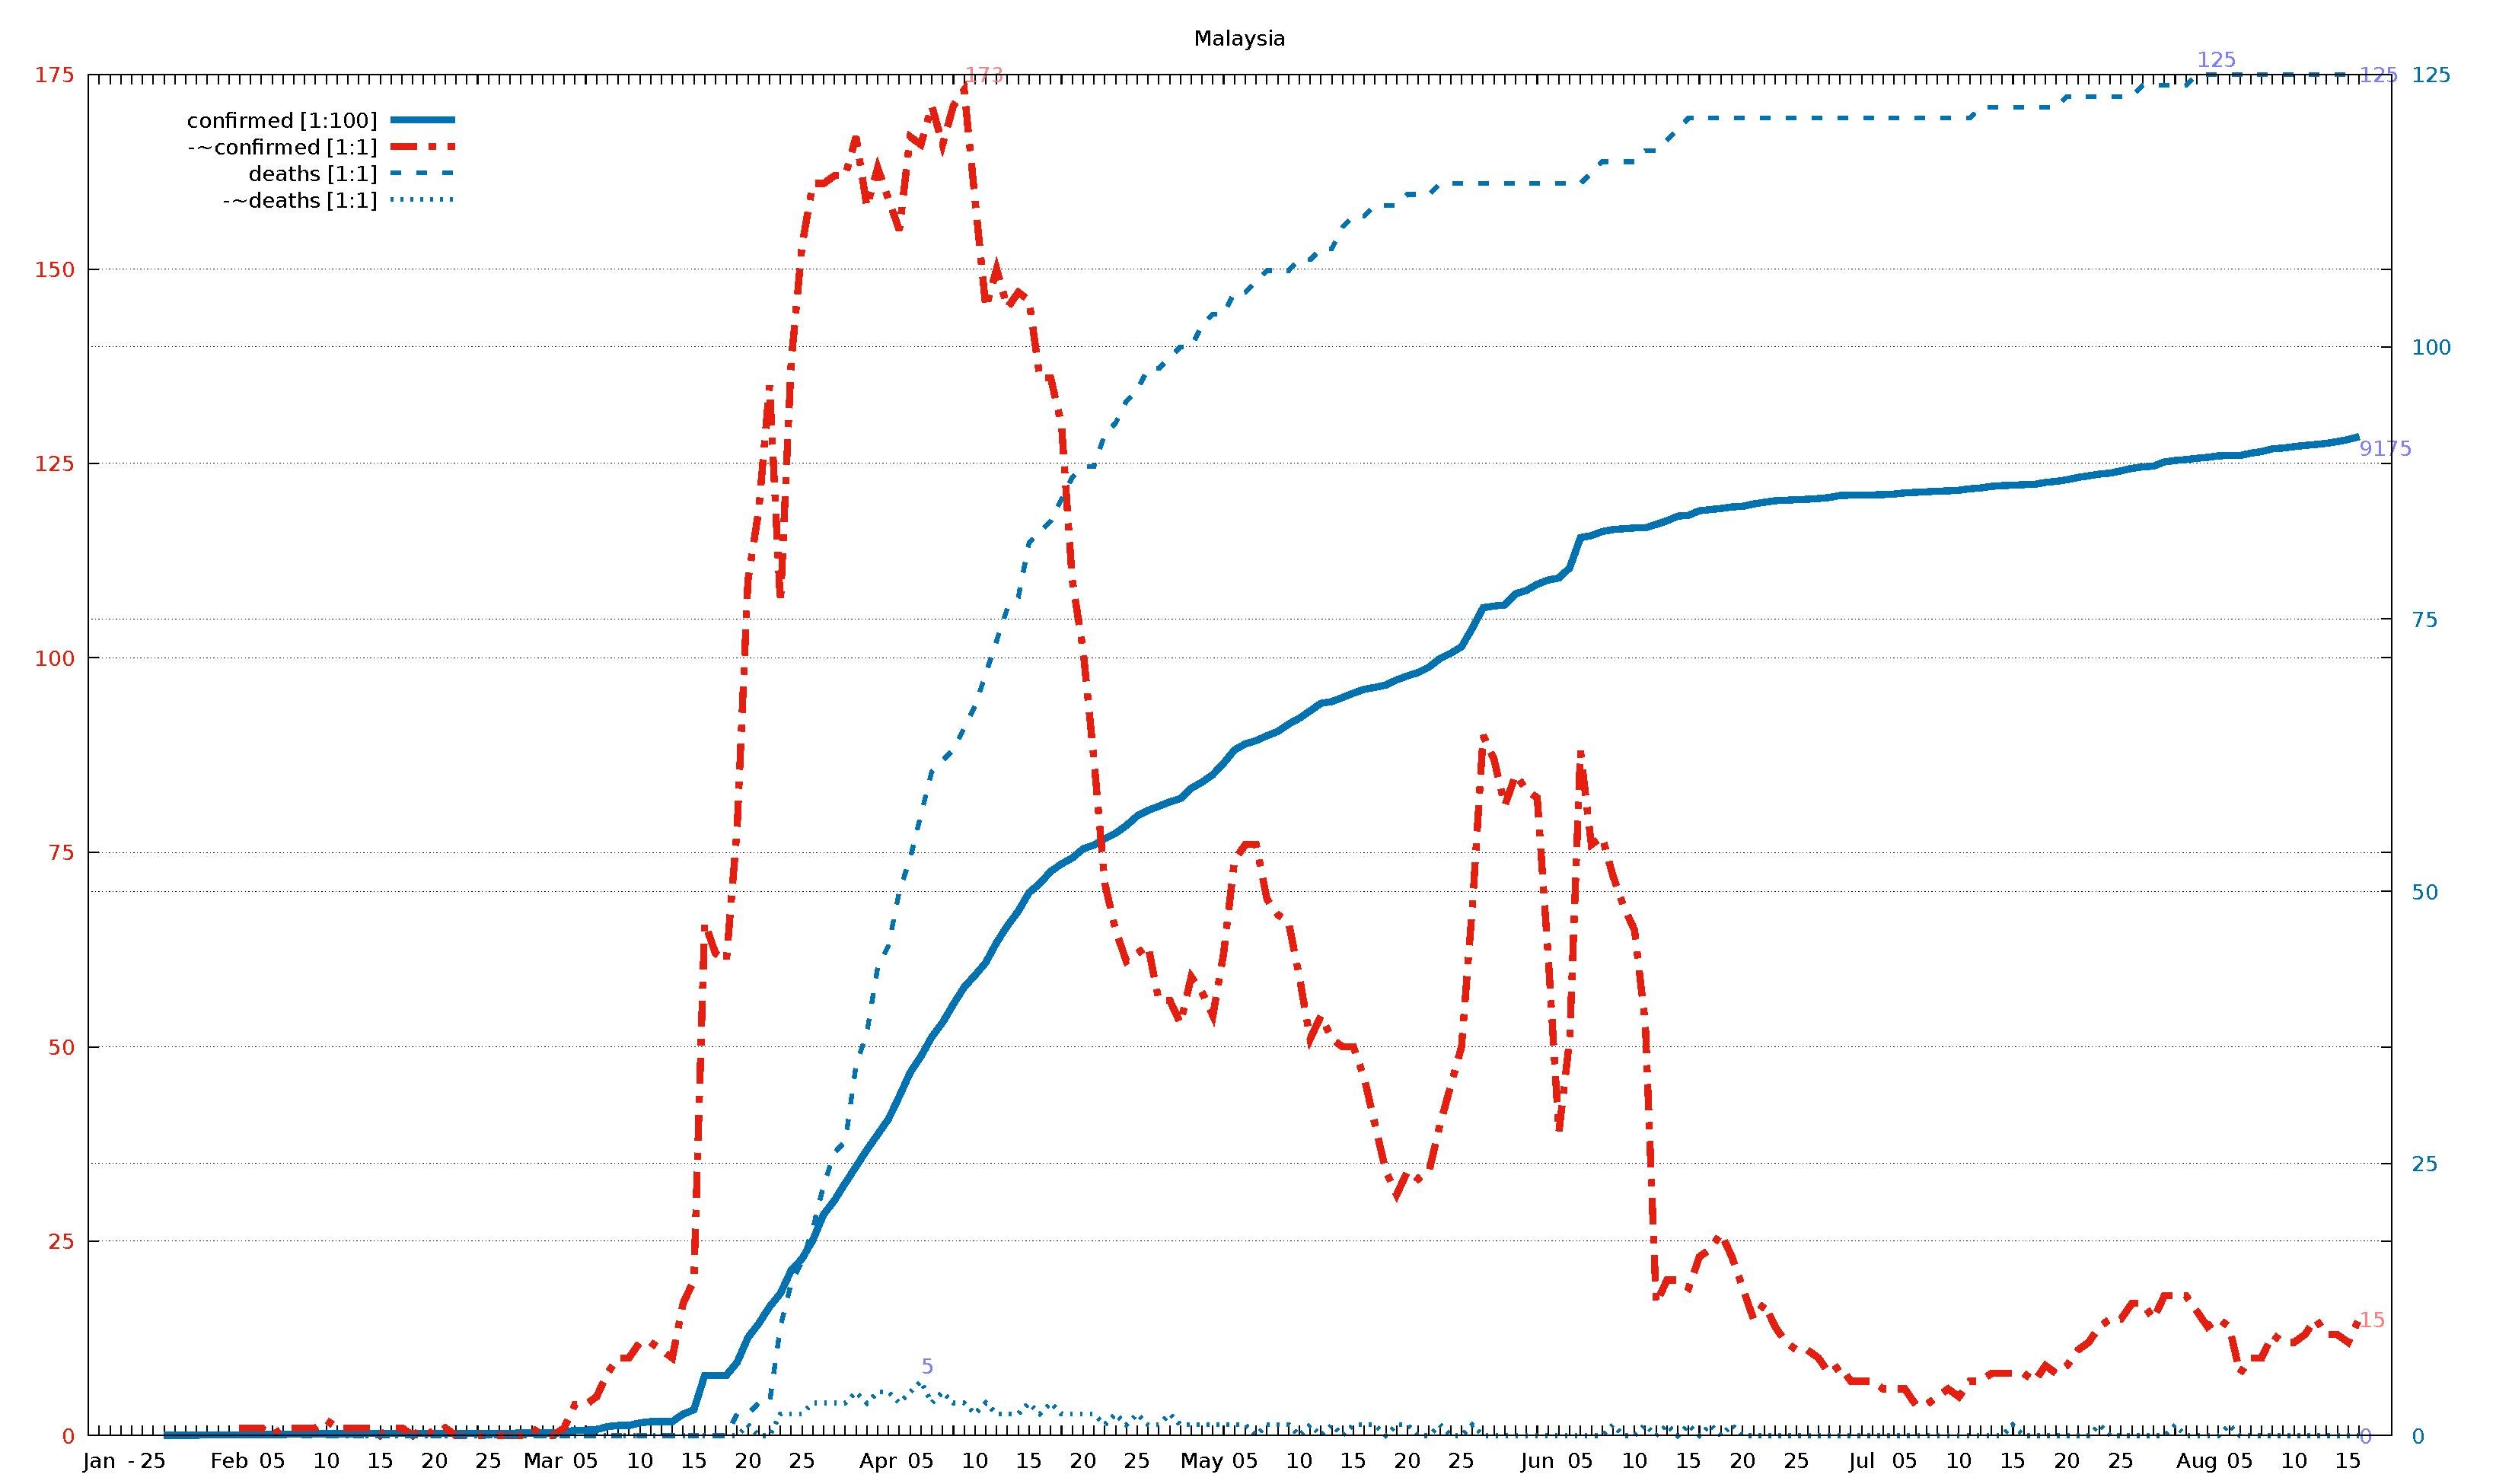
English: Diagram of WHO COVID-19 daily data (20 Jan - 16 Aug 2020) for "Total Confirmed Cases" (thick solid line), its smoothed increment (thick dash-dotted line), "Total Deaths" (thin dashed line) , and its smoothed increment (thin dotted line). Figures are taken from the available situation reports. Red and blue lines refer to the left and right vertical axis, respectively; the scaling factor for each curve is given in the legend. The horizontal axis starts on 20 Jan 2020 (situation report 1), and ends on 16 Aug 2020 (situation report 209). In the smoothed curves, for each day, 1/7 of the difference of the current day's figure and the figure a week ago is shown. For example, in situation report 115 (14 May 2020) and 121 (21 May 2020), there were 8676 and 5339 Total Confirmed Cases in Afghanistan, respectively, so the thick dash-dotted line passes through 477 = (8676-5339)/7 on 21 May.
For an overview of all related visualizations, and a more detailled description, see WHO Covid diagram set#Available country diagrams Jan-Aug 2020 (daily). |
| Date | |
| Source | Own work |
| Author | Jochen Burghardt |
Licensing
editI, the copyright holder of this work, hereby publish it under the following license:
This file is licensed under the Creative Commons Attribution-Share Alike 4.0 International license.
- You are free:
- to share – to copy, distribute and transmit the work
- to remix – to adapt the work
- Under the following conditions:
- attribution – You must give appropriate credit, provide a link to the license, and indicate if changes were made. You may do so in any reasonable manner, but not in any way that suggests the licensor endorses you or your use.
- share alike – If you remix, transform, or build upon the material, you must distribute your contributions under the same or compatible license as the original.
Gnuplot source code
edit| Gnuplot source code |
|---|
set term pdf size 22,13
set term pdf font "sans,20"
set output "WHO_Covid_C_Malaysia.pdf"
set key autotitle columnhead
set termoption noenhanced
# (1) norm: 918 173 125 001
# (2) dist: 1,0:188 2,0:136 2,1:139
# (3,4) dist max: 188 1:173--0:918
# (4) right: 1 0 1 1
# (6,7) scMax: 175 125
# (8) scale: [1:100] [1:1] [1:1] [1:1]


set xrange [-1:212]
set yrange [0:175]
set y2range [0:125]
set xtics 3650,100
set ytics 25 textcolor "#e51e10"
set y2tics 25 textcolor "#0072b2"
set grid y y2

set title "Malaysia"

$data <<EOF
rep day "confirmed [1:100]" "-~confirmed [1:1]" "deaths [1:1]" "-~deaths [1:1]"
1	Jan	.	-	.	-
2	""	.	-	.	-
3	""	.	-	.	-
-	-	-	-	-	-
4	""	.	-	.	-
5	25	.	-	.	-
6	""	3	-	.	-
7	""	4	-	.	-
8	""	4	-	.	-
9	""	4	-	.	-
10	""	7	-	.	-
11	""	8	-	.	-
12	Feb	8	-	.	-
13	""	8	1	.	-
14	""	8	1	0	-
15	""	10	1	0	-
16	05	10	0	0	-
17	""	12	1	0	-
18	""	14	1	0	-
19	""	15	1	0	-
20	""	17	1	0	-
21	10	18	2	0	0
22	""	18	1	0	0
23	""	18	1	0	0
24	""	18	1	0	0
25	""	19	1	0	0
26	15	21	0	0	0
27	""	22	1	0	0
28	""	22	1	0	0
29	""	22	0	0	0
30	""	22	1	0	0
31	20	22	0	0	0
32	""	22	1	0	0
33	""	22	0	0	0
34	""	22	0	0	0
35	""	22	0	0	0
36	25	22	0	0	0
37	""	22	0	0	0
38	""	22	0	0	0
39	""	24	0	0	0
40	""	24	1	0	0
41	Mar	24	0	0	0
42	""	24	0	0	0
43	""	29	1	0	0
44	""	50	4	0	0
45	05	50	4	0	0
46	""	55	5	0	0
47	""	83	8	0	0
48	""	93	10	0	0
49	""	93	10	0	0
50	10	117	12	0	0
51	""	129	12	0	0
52	""	129	11	0	0
53	""	129	10	0	0
54	""	197	17	0	0
55	15	238	20	0	0
56	""	553	66	0	0
57	""	553	62	0	0
58	""	553	61	0	0
59	""	673	78	2	0
60	20	900	110	2	1
61	""	1030	119	3	0
62	""	1183	135	3	0
63	""	1306	107	10	2
64	""	1518	138	14	2
65	25	1624	153	16	2
66	""	1796	161	19	3
67	""	2031	161	23	3
68	""	2161	162	26	3
69	""	2320	162	27	3
70	""	2470	167	34	4
71	""	2626	158	37	3
72	Apr	2766	163	43	4
73	""	2908	159	45	4
74	""	3116	155	50	3
75	""	3333	167	53	4
76	05	3483	166	57	5
77	""	3662	171	61	3
78	""	3793	166	62	4
79	""	3963	171	63	3
80	""	4119	173	65	3
81	10	4228	159	67	2
82	""	4346	145	70	3
83	""	4530	150	73	2
84	""	4683	145	76	2
85	""	4817	147	77	2
86	15	4987	146	82	3
87	""	5072	136	83	2
88	""	5182	136	84	3
89	""	5251	130	86	2
90	""	5305	110	88	2
91	20	5389	101	89	2
92	""	5424	87	89	2
93	""	5482	71	92	1
94	""	5532	65	93	2
95	""	5603	61	95	1
96	25	5691	62	96	2
97	""	5742	63	98	1
98	""	5780	56	98	1
99	""	5820	56	99	2
100	""	5851	53	100	1
101	""	5945	59	100	1
102	May	6002	57	102	1
103	""	6071	54	103	1
104	""	6176	62	103	1
105	""	6298	74	105	1
106	05	6353	76	105	1
107	""	6383	76	106	0
108	""	6428	69	107	1
109	""	6467	67	107	1
110	""	6535	66	107	1
111	10	6589	59	108	0
112	""	6656	51	108	1
113	""	6726	54	109	0
114	""	6742	51	109	1
115	""	6779	50	111	0
116	15	6819	50	112	1
117	""	6855	46	112	1
118	""	6872	40	113	1
119	""	6894	34	113	0
120	""	6941	31	113	1
121	20	6978	34	114	1
122	""	7009	33	114	0
123	""	7059	34	114	0
124	""	7137	40	115	1
125	""	7185	45	115	0
126	25	7245	50	115	0
127	""	7417	68	115	1
128	""	7604	90	115	0
129	""	7619	87	115	0
130	""	7629	81	115	0
131	""	7732	85	115	0
132	""	7762	83	115	0
133	Jun	7819	82	115	0
134	""	7857	62	115	0
135	""	7877	39	115	0
136	""	7970	51	115	0
137	05	8247	88	115	0
138	""	8266	76	116	0
139	""	8303	77	117	0
140	""	8322	72	117	1
141	""	8329	68	117	0
142	10	8336	65	117	0
143	""	8338	53	118	1
144	""	8369	17	118	0
145	""	8402	20	119	1
146	""	8445	20	120	0
147	15	8453	19	121	1
148	""	8494	23	121	0
149	""	8505	24	121	1
150	""	8515	26	121	0
151	""	8529	23	121	1
152	20	8535	19	121	0
153	""	8556	15	121	0
154	""	8572	17	121	0
155	""	8587	14	121	0
156	""	8590	12	121	0
157	25	8596	11	121	0
158	""	8600	11	121	0
159	""	8606	10	121	0
160	""	8616	8	121	0
161	""	8634	9	121	0
162	""	8637	7	121	0
163	Jul	8639	7	121	0
164	""	8640	7	121	0
165	""	8643	6	121	0
166	""	8648	6	121	0
167	05	8658	6	121	0
168	""	8663	4	121	0
169	""	8668	4	121	0
170	""	8674	5	121	0
171	""	8677	6	121	0
172	10	8683	5	121	0
173	""	8696	7	121	0
174	""	8704	7	122	0
175	""	8718	8	122	0
176	""	8725	8	122	0
177	15	8729	8	122	1
178	""	8734	8	122	0
179	""	8737	7	122	0
180	""	8755	9	122	0
181	""	8764	8	122	0
182	20	8779	9	123	0
183	""	8800	11	123	0
184	""	8815	12	123	0
185	""	8831	14	123	1
186	""	8840	15	123	0
187	25	8861	15	123	0
188	""	8884	17	123	0
189	""	8897	17	124	0
190	""	8904	15	124	0
191	""	8943	18	124	0
192	""	8956	18	124	1
193	""	8964	18	124	0
194	Aug	8976	16	125	0
195	""	8985	14	125	0
196	""	8999	15	125	0
197	""	9001	14	125	1
198	05	9002	8	125	0
199	""	9023	10	125	0
200	""	9038	10	125	0
201	""	9063	13	125	0
202	""	9070	12	125	0
203	10	9083	12	125	0
204	""	9094	13	125	0
205	""	9103	15	125	0
206	""	9114	13	125	0
207	""	9129	13	125	0
208	15	9149	12	125	0
209	""	9175	15	125	0
EOF

# confirmed:
set label "9175   " at first 209, 91*175/125   left back textcolor "#8080ff"
# -~confirmed:
set label "15     " at first 209, 15           left back textcolor "#ff8080"
set label "173    " at first  80,173        +2 left back textcolor "#ff8080"
# deaths:
set label "125    " at first 209,125*175/125   left back textcolor "#8080ff"
set label "125    " at first 194,125*175/125+2 left back textcolor "#8080ff"
# -~deaths:
set label "0      " at first 209,  0*175/125   left back textcolor "#8080ff"
set label "5      " at first  76,  5*175/125+2 left back textcolor "#8080ff"

set multiplot
  plot $data using 0:($3/    100*175/125) with lines lc 6 lw 8 dt 1 title at 0.150, 0.920
replot $data using 0:($4/      1        ) with lines lc 7 lw 8 dt 4 title at 0.150, 0.902
replot $data using 0:($5/      1*175/125) with lines lc 6 lw 5 dt 2 title at 0.150, 0.884
replot $data using 0:($6/      1*175/125) with lines lc 6 lw 5 dt 3 title at 0.150, 0.866

# plot hor axis calendar
replot $data using 0:(0):xticlabel(2) with lines
|
File history
Click on a date/time to view the file as it appeared at that time.
| Date/Time | Thumbnail | Dimensions | User | Comment | |
|---|---|---|---|---|---|
| current | 19:20, 24 September 2020 |  | 3,300 × 1,950 (23 KB) | Jochen Burghardt (talk | contribs) | =={{int:filedesc}}== {{Information |description={{en|1=Diagram of WHO COVID-19 daily data (20 Jan - 16 Aug 2020) for ''"Total Confirmed Cases"'' (thick solid line), its smoothed increment (thick dash-dotted line), ''"Total Deaths"'' (thin dashed line), and its smoothed increment (thin dotted line); see File:WHO_Covid_2020_Jan-Aug_daily_C_Afghanistan.pdf for details.}} |date=2020-09-24 |source={{own}} |author=Jochen Burghardt |permission= |other_versions=[[:File:... |
You cannot overwrite this file.
File usage on Commons
There are no pages that use this file.