File:WHO Covid 2020 Jan-Aug daily C Malta.pdf

Size of this JPG preview of this PDF file: 800 × 473 pixels. Other resolutions: 320 × 189 pixels | 640 × 378 pixels | 1,024 × 605 pixels | 1,280 × 756 pixels | 3,300 × 1,950 pixels.
Original file (3,300 × 1,950 pixels, file size: 20 KB, MIME type: application/pdf)
Captions
Captions
Add a one-line explanation of what this file represents
Summary
edit| Description |
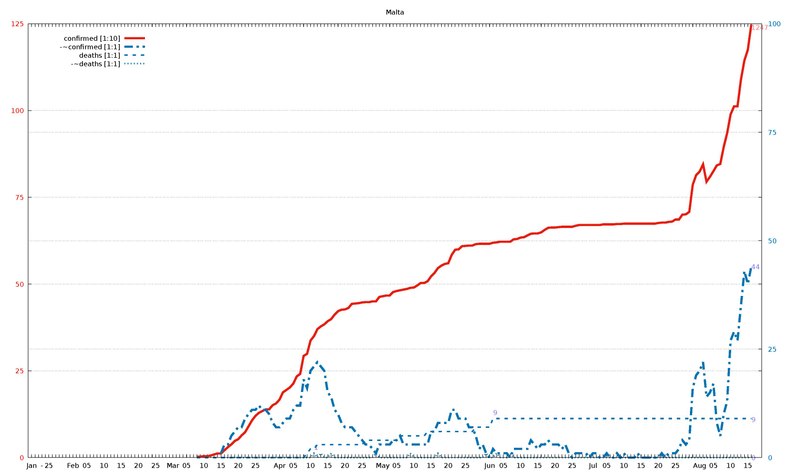
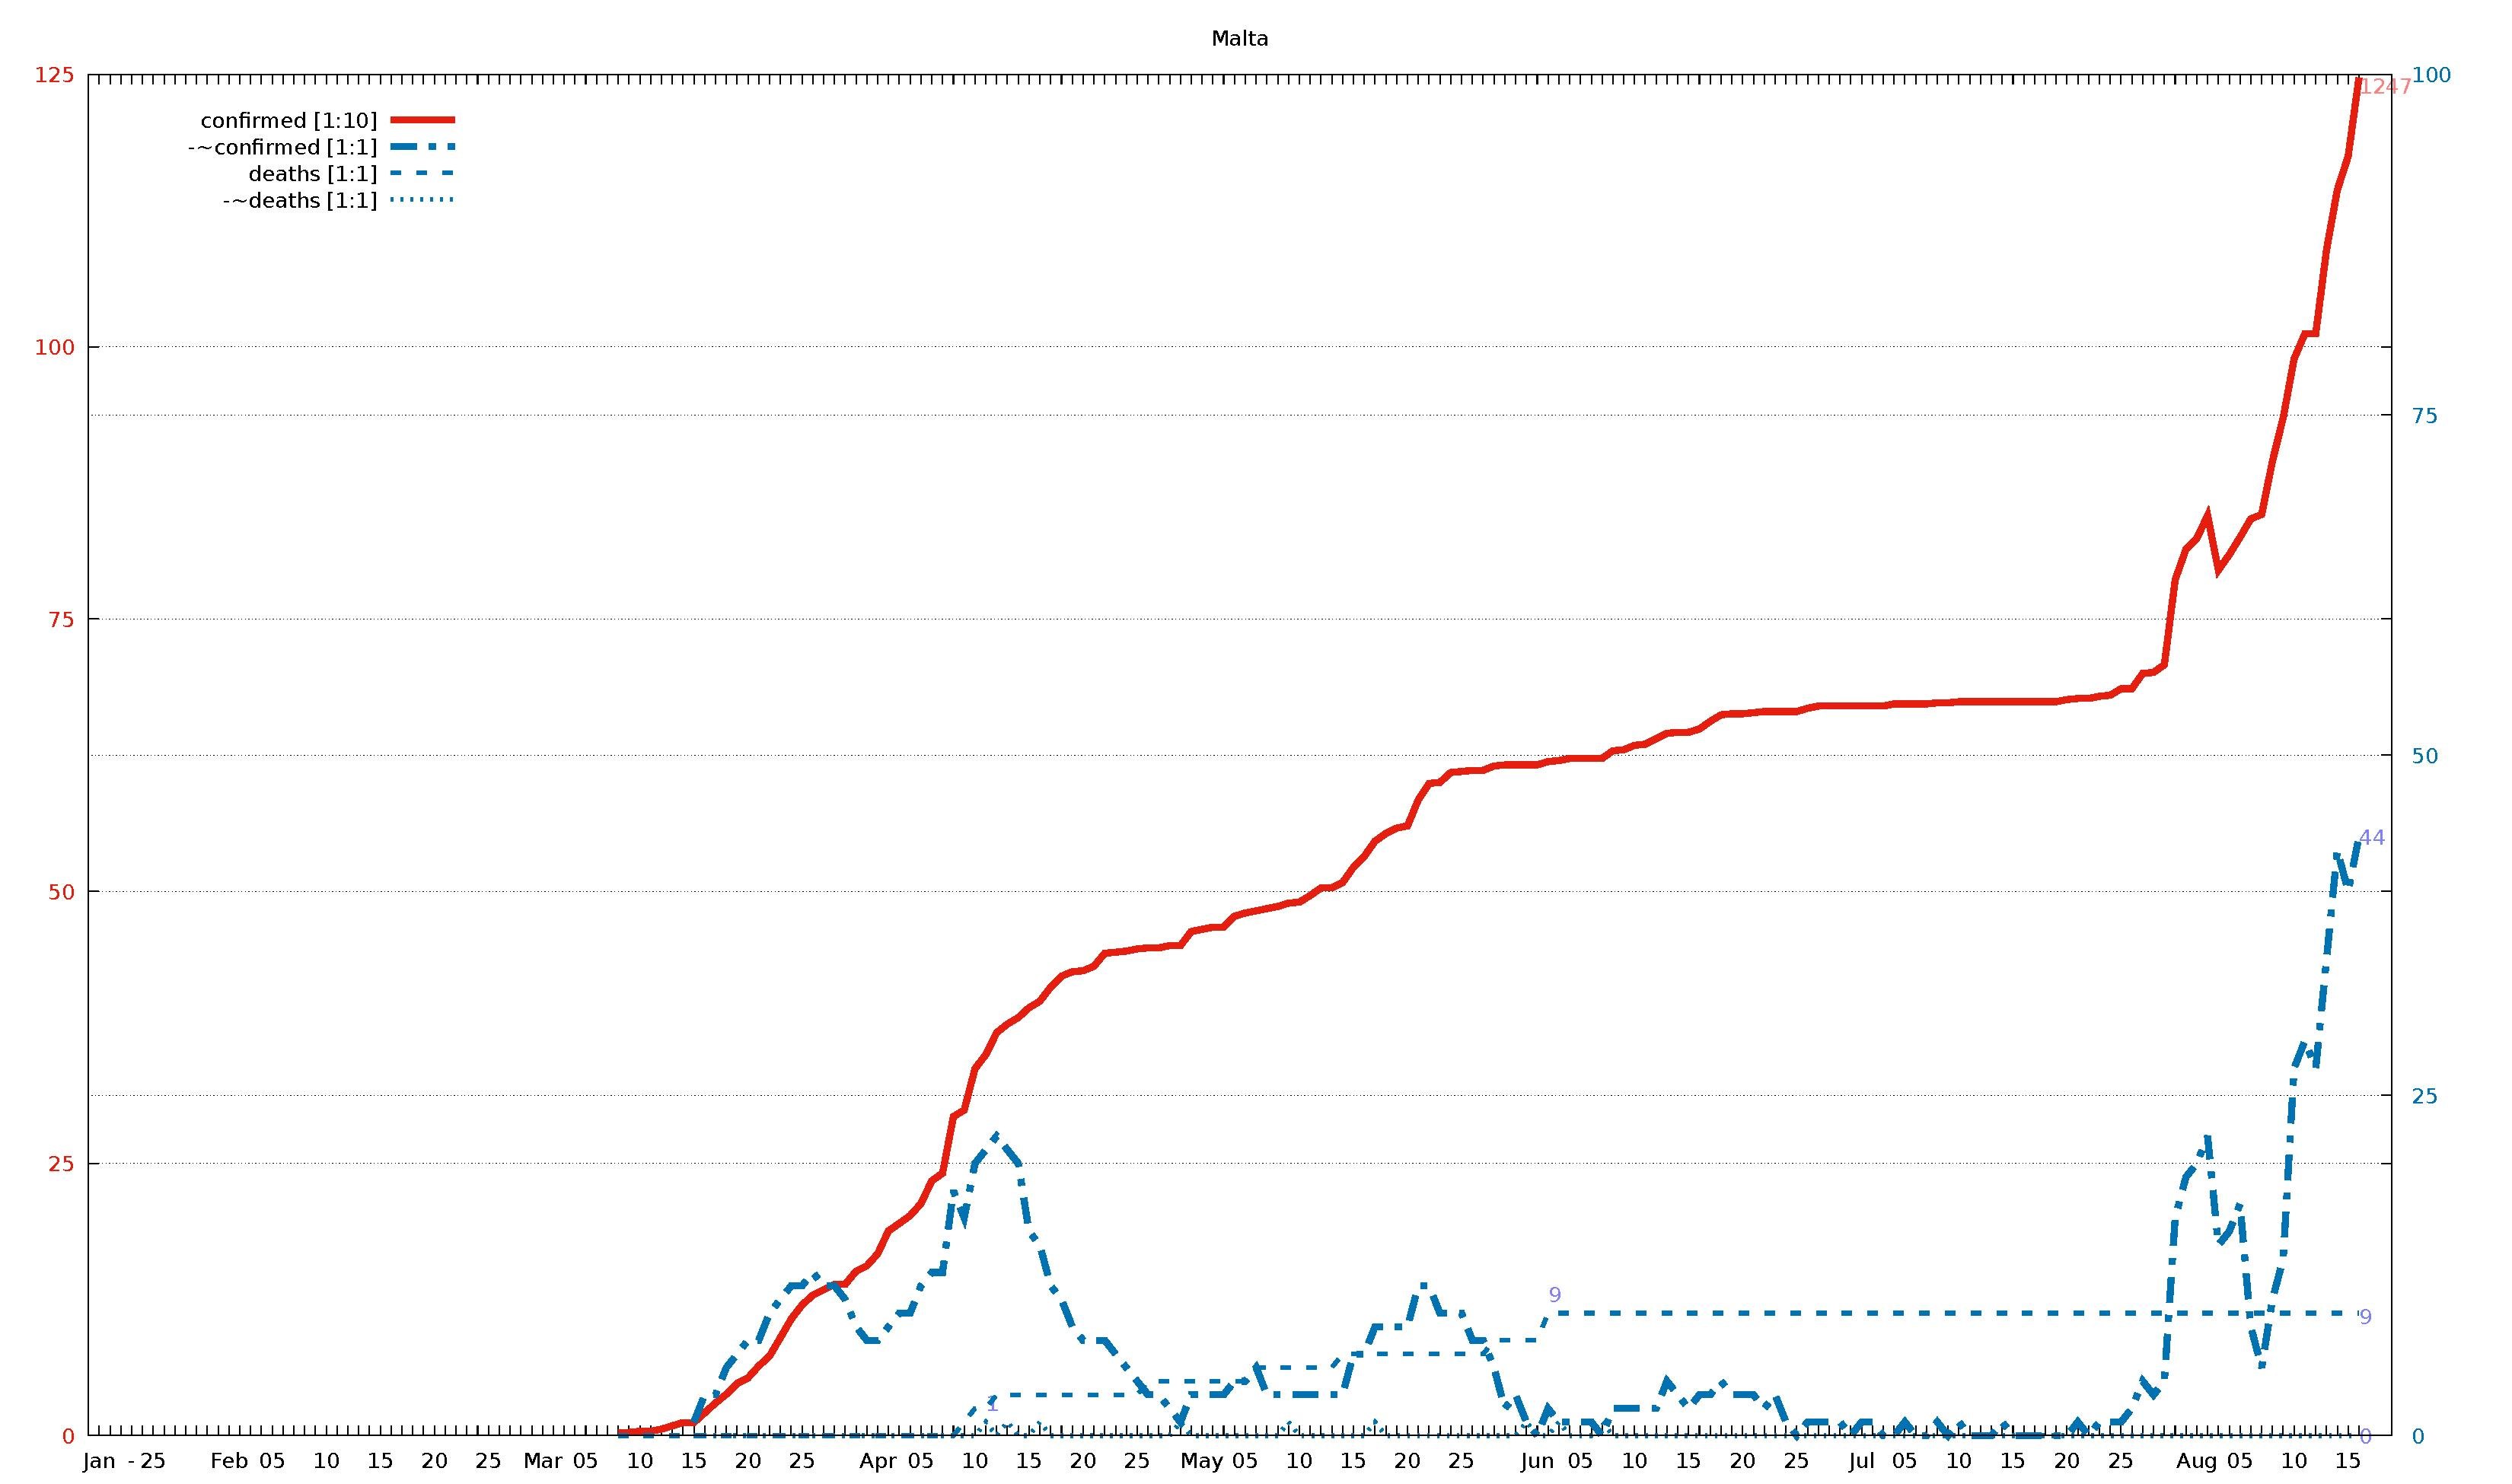
English: Diagram of WHO COVID-19 daily data (20 Jan - 16 Aug 2020) for "Total Confirmed Cases" (thick solid line), its smoothed increment (thick dash-dotted line), "Total Deaths" (thin dashed line) , and its smoothed increment (thin dotted line). Figures are taken from the available situation reports. Red and blue lines refer to the left and right vertical axis, respectively; the scaling factor for each curve is given in the legend. The horizontal axis starts on 20 Jan 2020 (situation report 1), and ends on 16 Aug 2020 (situation report 209). In the smoothed curves, for each day, 1/7 of the difference of the current day's figure and the figure a week ago is shown. For example, in situation report 115 (14 May 2020) and 121 (21 May 2020), there were 8676 and 5339 Total Confirmed Cases in Afghanistan, respectively, so the thick dash-dotted line passes through 477 = (8676-5339)/7 on 21 May.
For an overview of all related visualizations, and a more detailled description, see WHO Covid diagram set#Available country diagrams Jan-Aug 2020 (daily). |
| Date | |
| Source | Own work |
| Author | Jochen Burghardt |
Licensing
editI, the copyright holder of this work, hereby publish it under the following license:
This file is licensed under the Creative Commons Attribution-Share Alike 4.0 International license.
- You are free:
- to share – to copy, distribute and transmit the work
- to remix – to adapt the work
- Under the following conditions:
- attribution – You must give appropriate credit, provide a link to the license, and indicate if changes were made. You may do so in any reasonable manner, but not in any way that suggests the licensor endorses you or your use.
- share alike – If you remix, transform, or build upon the material, you must distribute your contributions under the same or compatible license as the original.
Gnuplot source code
edit| Gnuplot source code |
|---|
set term pdf size 22,13
set term pdf font "sans,20"
set output "WHO_Covid_C_Malta.pdf"
set key autotitle columnhead
set termoption noenhanced
# (1) norm: 125 001 001 001

set xrange [-1:212]
set yrange [0:125]
set y2range [0:100]
set xtics 3650,100
set ytics 25 textcolor "#e51e10"
set y2tics 25 textcolor "#0072b2"
set grid y y2

set title "Malta"

$data <<EOF
rep day "confirmed [1:10]" "-~confirmed [1:1]" "deaths [1:1]" "-~deaths [1:1]"
1	Jan	.	-	.	-
2	""	.	-	.	-
3	""	.	-	.	-
-	-	-	-	-	-
4	""	.	-	.	-
5	25	.	-	.	-
6	""	.	-	.	-
7	""	.	-	.	-
8	""	.	-	.	-
9	""	.	-	.	-
10	""	.	-	.	-
11	""	.	-	.	-
12	Feb	.	-	.	-
13	""	.	-	.	-
14	""	.	-	.	-
15	""	.	-	.	-
16	05	.	-	.	-
17	""	.	-	.	-
18	""	.	-	.	-
19	""	.	-	.	-
20	""	.	-	.	-
21	10	.	-	.	-
22	""	.	-	.	-
23	""	.	-	.	-
24	""	.	-	.	-
25	""	.	-	.	-
26	15	.	-	.	-
27	""	.	-	.	-
28	""	.	-	.	-
29	""	.	-	.	-
30	""	.	-	.	-
31	20	.	-	.	-
32	""	.	-	.	-
33	""	.	-	.	-
34	""	.	-	.	-
35	""	.	-	.	-
36	25	.	-	.	-
37	""	.	-	.	-
38	""	.	-	.	-
39	""	.	-	.	-
40	""	.	-	.	-
41	Mar	.	-	.	-
42	""	.	-	.	-
43	""	.	-	.	-
44	""	.	-	.	-
45	05	.	-	.	-
46	""	.	-	.	-
47	""	.	-	.	-
48	""	3	-	0	-
49	""	3	-	0	-
50	10	4	-	0	-
51	""	4	-	0	-
52	""	6	-	0	-
53	""	9	-	0	-
54	""	12	-	0	-
55	15	12	1	0	0
56	""	21	3	0	0
57	""	30	3	0	0
58	""	38	5	0	0
59	""	48	6	0	0
60	20	53	7	0	0
61	""	64	7	0	0
62	""	73	9	0	0
63	""	90	10	0	0
64	""	107	11	0	0
65	25	120	11	0	0
66	""	129	12	0	0
67	""	134	11	0	0
68	""	139	11	0	0
69	""	139	10	0	0
70	""	151	8	0	0
71	""	156	7	0	0
72	Apr	167	7	0	0
73	""	188	8	0	0
74	""	195	9	0	0
75	""	202	9	0	0
76	05	213	11	0	0
77	""	234	12	0	0
78	""	241	12	0	0
79	""	293	18	0	0
80	""	299	16	1	0
81	10	337	20	2	0
82	""	350	21	2	1
83	""	370	22	3	0
84	""	378	21	3	1
85	""	384	20	3	0
86	15	393	15	3	0
87	""	399	14	3	1
88	""	412	11	3	0
89	""	422	10	3	0
90	""	426	8	3	0
91	20	427	7	3	0
92	""	431	7	3	0
93	""	443	7	3	0
94	""	444	6	3	0
95	""	445	5	3	0
96	25	447	4	3	0
97	""	448	3	4	0
98	""	448	3	4	0
99	""	450	2	4	0
100	""	450	1	4	1
101	""	463	3	4	0
102	May	465	3	4	0
103	""	467	3	4	0
104	""	467	3	4	0
105	""	477	4	4	0
106	05	480	4	4	0
107	""	482	5	5	0
108	""	484	3	5	0
109	""	486	3	5	0
110	""	489	3	5	1
111	10	490	3	5	0
112	""	496	3	5	0
113	""	503	3	5	0
114	""	503	3	5	0
115	""	508	3	6	0
116	15	522	6	6	0
117	""	532	6	6	0
118	""	546	8	6	1
119	""	553	8	6	0
120	""	558	8	6	0
121	20	560	8	6	0
122	""	584	11	6	0
123	""	599	11	6	0
124	""	600	9	6	0
125	""	609	9	6	0
126	25	610	9	6	0
127	""	611	7	6	0
128	""	611	7	6	0
129	""	615	5	7	0
130	""	616	2	7	0
131	""	616	3	7	0
132	""	616	1	7	1
133	Jun	616	0	7	0
134	""	619	2	9	0
135	""	620	1	9	1
136	""	622	1	9	0
137	05	622	1	9	0
138	""	622	1	9	0
139	""	622	0	9	1
140	""	629	2	9	0
141	""	630	2	9	0
142	10	634	2	9	0
143	""	635	2	9	0
144	""	640	2	9	0
145	""	645	4	9	0
146	""	646	3	9	0
147	15	646	2	9	0
148	""	649	3	9	0
149	""	656	3	9	0
150	""	662	4	9	0
151	""	663	3	9	0
152	20	663	3	9	0
153	""	664	3	9	0
154	""	665	2	9	0
155	""	665	3	9	0
156	""	665	1	9	0
157	25	665	0	9	0
158	""	668	1	9	0
159	""	670	1	9	0
160	""	670	1	9	0
161	""	670	1	9	0
162	""	670	0	9	0
163	Jul	670	1	9	0
164	""	670	1	9	0
165	""	670	0	9	0
166	""	672	0	9	0
167	05	672	1	9	0
168	""	672	0	9	0
169	""	672	0	9	0
170	""	673	1	9	0
171	""	673	0	9	0
172	10	674	1	9	0
173	""	674	0	9	0
174	""	674	0	9	0
175	""	674	0	9	0
176	""	674	1	9	0
177	15	674	0	9	0
178	""	674	0	9	0
179	""	674	0	9	0
180	""	674	0	9	0
181	""	674	0	9	0
182	20	676	0	9	0
183	""	677	1	9	0
184	""	677	0	9	0
185	""	679	1	9	0
186	""	680	1	9	0
187	25	686	1	9	0
188	""	686	2	9	0
189	""	700	4	9	0
190	""	701	3	9	0
191	""	708	4	9	0
192	""	786	16	9	0
193	""	814	19	9	0
194	Aug	824	20	9	0
195	""	845	22	9	0
196	""	795	14	9	0
197	""	809	15	9	0
198	05	825	17	9	0
199	""	842	8	9	0
200	""	846	5	9	0
201	""	895	10	9	0
202	""	935	13	9	0
203	10	989	27	9	0
204	""	1012	29	9	0
205	""	1012	27	9	0
206	""	1089	35	9	0
207	""	1144	43	9	0
208	15	1175	40	9	0
209	""	1247	44	9	0
EOF

# confirmed:
set label "1247   " at first 209,124           left back textcolor "#ff8080"
# -~confirmed:
set label "44     " at first 209, 44*125/100   left back textcolor "#8080ff"
# deaths:
set label "9      " at first 209,  9*125/100   left back textcolor "#8080ff"
set label "9      " at first 134,  9*125/100+2 left back textcolor "#8080ff"
# -~deaths:
set label "0      " at first 209,  0*125/100   left back textcolor "#8080ff"
set label "1      " at first  82,  1*125/100+2 left back textcolor "#8080ff"

set multiplot
  plot $data using 0:($3/     10        ) with lines lc 7 lw 8 dt 1 title at 0.150, 0.920
replot $data using 0:($4/      1*125/100) with lines lc 6 lw 8 dt 4 title at 0.150, 0.902
replot $data using 0:($5/      1*125/100) with lines lc 6 lw 5 dt 2 title at 0.150, 0.884
replot $data using 0:($6/      1*125/100) with lines lc 6 lw 5 dt 3 title at 0.150, 0.866

# plot hor axis calendar
replot $data using 0:(0):xticlabel(2) with lines
|
File history
Click on a date/time to view the file as it appeared at that time.
| Date/Time | Thumbnail | Dimensions | User | Comment | |
|---|---|---|---|---|---|
| current | 19:21, 24 September 2020 |  | 3,300 × 1,950 (20 KB) | Jochen Burghardt (talk | contribs) | =={{int:filedesc}}== {{Information |description={{en|1=Diagram of WHO COVID-19 daily data (20 Jan - 16 Aug 2020) for ''"Total Confirmed Cases"'' (thick solid line), its smoothed increment (thick dash-dotted line), ''"Total Deaths"'' (thin dashed line), and its smoothed increment (thin dotted line); see File:WHO_Covid_2020_Jan-Aug_daily_C_Afghanistan.pdf for details.}} |date=2020-09-24 |source={{own}} |author=Jochen Burghardt |permission= |other_versions=[[:File:... |
You cannot overwrite this file.
File usage on Commons
There are no pages that use this file.