File:WHO Covid 2020 Jan-Aug daily C Pakistan.pdf

Size of this JPG preview of this PDF file: 800 × 473 pixels. Other resolutions: 320 × 189 pixels | 640 × 378 pixels | 1,024 × 605 pixels | 1,280 × 756 pixels | 3,300 × 1,950 pixels.
Original file (3,300 × 1,950 pixels, file size: 24 KB, MIME type: application/pdf)
Captions
Captions
Add a one-line explanation of what this file represents
Summary
edit| Description |
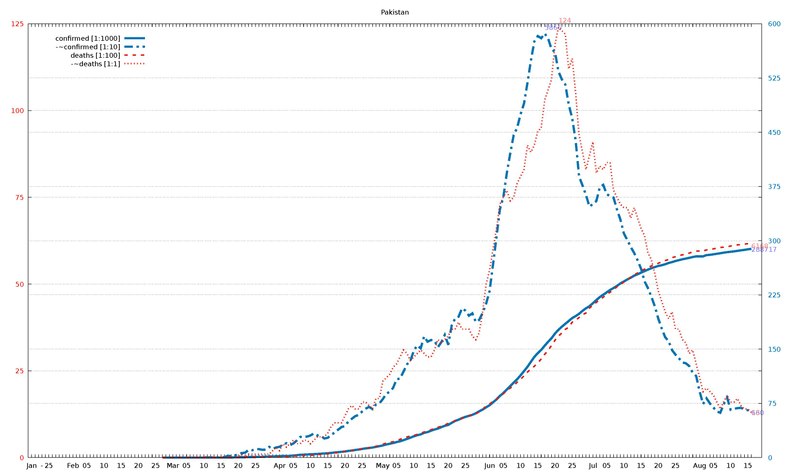
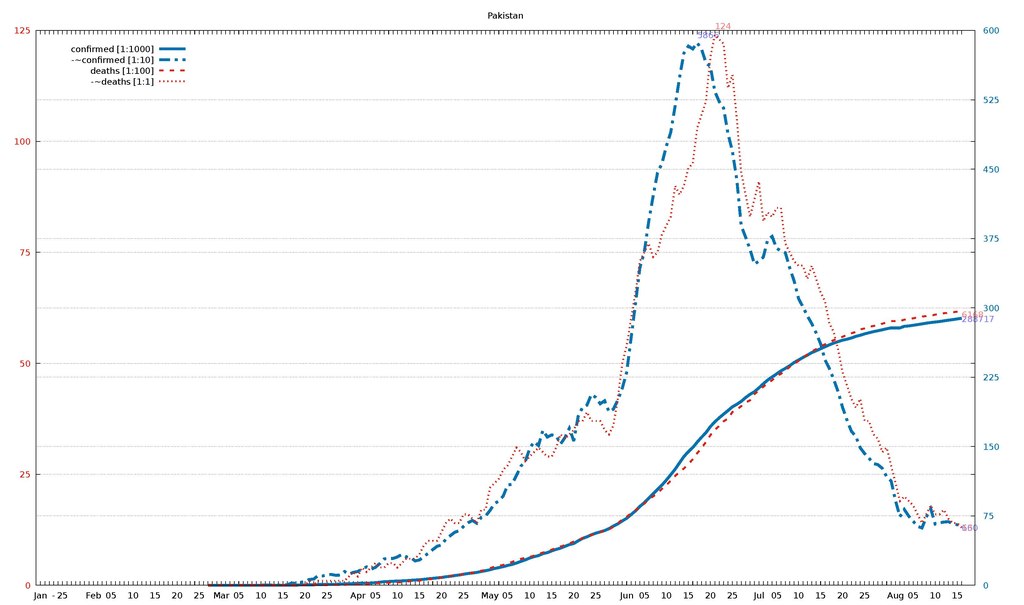
English: Diagram of WHO COVID-19 daily data (20 Jan - 16 Aug 2020) for "Total Confirmed Cases" (thick solid line), its smoothed increment (thick dash-dotted line), "Total Deaths" (thin dashed line) , and its smoothed increment (thin dotted line). Figures are taken from the available situation reports. Red and blue lines refer to the left and right vertical axis, respectively; the scaling factor for each curve is given in the legend. The horizontal axis starts on 20 Jan 2020 (situation report 1), and ends on 16 Aug 2020 (situation report 209). In the smoothed curves, for each day, 1/7 of the difference of the current day's figure and the figure a week ago is shown. For example, in situation report 115 (14 May 2020) and 121 (21 May 2020), there were 8676 and 5339 Total Confirmed Cases in Afghanistan, respectively, so the thick dash-dotted line passes through 477 = (8676-5339)/7 on 21 May.
For an overview of all related visualizations, and a more detailled description, see WHO Covid diagram set#Available country diagrams Jan-Aug 2020 (daily). |
| Date | |
| Source | Own work |
| Author | Jochen Burghardt |
Licensing
editI, the copyright holder of this work, hereby publish it under the following license:
This file is licensed under the Creative Commons Attribution-Share Alike 4.0 International license.
- You are free:
- to share – to copy, distribute and transmit the work
- to remix – to adapt the work
- Under the following conditions:
- attribution – You must give appropriate credit, provide a link to the license, and indicate if changes were made. You may do so in any reasonable manner, but not in any way that suggests the licensor endorses you or your use.
- share alike – If you remix, transform, or build upon the material, you must distribute your contributions under the same or compatible license as the original.
Gnuplot source code
edit| Gnuplot source code |
|---|
set term pdf size 22,13
set term pdf font "sans,20"
set output "WHO_Covid_C_Pakistan.pdf"
set key autotitle columnhead
set termoption noenhanced
# (1) norm: 289 587 617 124
# (2) dist: 1,0:204 2,0:214 2,1:106 3,0:233 3,1:211 3,2:200
# (3,4) dist max: 233 3:124--0:289
# (4) right: 1 1 0 0
# (6,7) scMax: 125 600
# (8) scale: [1:1000] [1:10] [1:100] [1:1]


set xrange [-1:212]
set yrange [0:125]
set y2range [0:600]
set xtics 3650,100
set ytics 25 textcolor "#e51e10"
set y2tics 75 textcolor "#0072b2"
set grid y y2

set title "Pakistan"

$data <<EOF
rep day "confirmed [1:1000]" "-~confirmed [1:10]" "deaths [1:100]" "-~deaths [1:1]"
1	Jan	.	-	.	-
2	""	.	-	.	-
3	""	.	-	.	-
-	-	-	-	-	-
4	""	.	-	.	-
5	25	.	-	.	-
6	""	.	-	.	-
7	""	.	-	.	-
8	""	.	-	.	-
9	""	.	-	.	-
10	""	.	-	.	-
11	""	.	-	.	-
12	Feb	.	-	.	-
13	""	.	-	.	-
14	""	.	-	.	-
15	""	.	-	.	-
16	05	.	-	.	-
17	""	.	-	.	-
18	""	.	-	.	-
19	""	.	-	.	-
20	""	.	-	.	-
21	10	.	-	.	-
22	""	.	-	.	-
23	""	.	-	.	-
24	""	.	-	.	-
25	""	.	-	.	-
26	15	.	-	.	-
27	""	.	-	.	-
28	""	.	-	.	-
29	""	.	-	.	-
30	""	.	-	.	-
31	20	.	-	.	-
32	""	.	-	.	-
33	""	.	-	.	-
34	""	.	-	.	-
35	""	.	-	.	-
36	25	.	-	.	-
37	""	.	-	.	-
38	""	2	-	0	-
39	""	2	-	0	-
40	""	2	-	0	-
41	Mar	4	-	0	-
42	""	4	-	0	-
43	""	5	-	0	-
44	""	5	-	0	-
45	05	5	1	0	0
46	""	5	0	0	0
47	""	5	1	0	0
48	""	5	0	0	0
49	""	6	0	0	0
50	10	16	2	0	0
51	""	16	1	0	0
52	""	19	2	0	0
53	""	20	2	0	0
54	""	21	3	0	0
55	15	28	3	0	0
56	""	52	7	0	0
57	""	187	24	0	0
58	""	187	24	0	0
59	""	241	32	0	0
60	20	302	40	2	0
61	""	461	63	2	1
62	""	495	67	3	0
63	""	784	105	5	1
64	""	887	100	6	1
65	25	991	114	7	1
66	""	1057	117	8	1
67	""	1057	108	8	1
68	""	1235	110	9	1
69	""	1526	148	13	1
70	""	1625	120	18	2
71	""	1865	140	25	3
72	Apr	2039	149	26	2
73	""	2291	177	31	4
74	""	2450	199	35	3
75	""	2450	173	35	4
76	05	2880	194	45	5
77	""	3277	236	50	4
78	""	3864	285	54	4
79	""	4072	291	58	5
80	""	4322	290	63	5
81	10	4601	307	66	4
82	""	4788	334	71	5
83	""	5038	308	86	6
84	""	5374	300	93	6
85	""	5716	264	96	6
86	15	5988	274	107	7
87	""	6505	312	124	9
88	""	7025	346	135	10
89	""	7481	385	143	10
90	""	7993	422	159	10
91	20	8418	435	176	12
92	""	9216	500	192	14
93	""	9749	537	209	15
94	""	10513	573	224	14
95	""	11155	590	237	14
96	25	11940	637	253	16
97	""	12723	676	269	16
98	""	13328	701	281	15
99	""	13915	671	292	14
100	""	14885	734	327	17
101	""	15759	749	346	17
102	May	16817	809	385	22
103	""	18114	882	417	23
104	""	19103	912	440	24
105	""	20084	965	457	26
106	05	21501	1084	486	27
107	""	22533	1092	526	29
108	""	24073	1188	564	31
109	""	25837	1288	594	30
110	""	27474	1338	618	28
111	10	29465	1480	639	29
112	""	30941	1551	667	30
113	""	32081	1511	706	31
114	""	34261	1676	737	30
115	""	35298	1603	761	29
116	15	37218	1626	803	29
117	""	38799	1618	834	31
118	""	40151	1527	873	34
119	""	42125	1597	903	33
120	""	43966	1698	939	34
121	20	45184	1561	985	35
122	""	48091	1827	1017	37
123	""	50694	1925	1067	37
124	""	52437	1949	1101	39
125	""	54601	2064	1133	37
126	25	56349	2032	1167	37
127	""	57705	1963	1197	37
128	""	59151	1995	1225	35
129	""	61227	1876	1260	34
130	""	64028	1905	1317	36
131	""	66457	2003	1395	42
132	""	69496	2128	1483	50
133	Jun	72460	2302	1543	54
134	""	76398	2670	1621	60
135	""	80463	3045	1688	66
136	""	85264	3433	1770	73
137	05	89249	3603	1838	75
138	""	93983	3933	1935	77
139	""	98943	4206	2002	74
140	""	103671	4459	2067	75
141	""	108317	4560	2172	79
142	10	113702	4748	2255	81
143	""	119536	4896	2356	83
144	""	125521	5182	2463	90
145	""	132405	5489	2551	88
146	""	139230	5755	2632	90
147	15	144478	5830	2729	94
148	""	148921	5800	2839	95
149	""	154760	5866	2975	103
150	""	160118	5797	3093	106
151	""	165062	5649	3229	109
152	20	171666	5609	3382	119
153	""	176617	5341	3501	124
154	""	181088	5230	3590	123
155	""	185034	5159	3695	122
156	""	188926	4881	3755	112
157	25	192970	4693	3903	115
158	""	195745	4383	3962	105
159	""	198883	3888	4035	93
160	""	202955	3763	4118	88
161	""	206512	3632	4167	83
162	""	209337	3472	4304	87
163	Jul	213470	3506	4395	91
164	""	217809	3548	4473	82
165	""	221896	3736	4551	84
166	""	225283	3772	4619	83
167	05	228474	3645	4712	85
168	""	231818	3615	4762	85
169	""	234509	3596	4839	77
170	""	237489	3432	4922	75
171	""	240848	3291	4983	73
172	10	243596	3100	5058	72
173	""	246351	3010	5123	72
174	""	248872	2914	5197	69
175	""	251625	2829	5266	72
176	""	253604	2728	5320	69
177	15	255769	2611	5386	66
178	""	257914	2438	5426	64
179	""	259999	2344	5475	59
180	""	261917	2223	5522	57
181	""	263496	2090	5568	53
182	20	265083	1922	5599	48
183	""	266096	1785	5639	45
184	""	267428	1665	5677	42
185	""	269191	1611	5709	40
186	""	270400	1486	5763	42
187	25	271887	1424	5787	37
188	""	273113	1374	5822	37
189	""	274289	1315	5842	34
190	""	275225	1305	5865	33
191	""	276288	1265	5892	30
192	""	277402	1173	5924	31
193	""	278305	1130	5951	27
194	Aug	278305	916	5951	23
195	""	278305	742	5951	19
196	""	280029	820	5984	20
197	""	280461	748	5999	19
198	05	281136	693	6014	18
199	""	281863	637	6035	16
200	""	282645	620	6052	14
201	""	283469	738	6066	16
202	""	284103	828	6074	18
203	10	284660	662	6097	16
204	""	285191	675	6112	16
205	""	285921	684	6129	17
206	""	286683	688	6139	15
207	""	287300	665	6153	14
208	15	288047	654	6162	14
209	""	288717	660	6168	13
EOF

# confirmed:
set label "288717 " at first 209,288*125/600   left back textcolor "#8080ff"
# -~confirmed:
set label "660    " at first 209, 66*125/600   left back textcolor "#8080ff"
set label "5866   " at first 149,586*125/600+2 left back textcolor "#8080ff"
# deaths:
set label "6168   " at first 209, 61           left back textcolor "#ff8080"
# -~deaths:
set label "13     " at first 209, 13           left back textcolor "#ff8080"
set label "124    " at first 153,124        +2 left back textcolor "#ff8080"

set multiplot
  plot $data using 0:($3/   1000*125/600) with lines lc 6 lw 8 dt 1 title at 0.150, 0.920
replot $data using 0:($4/     10*125/600) with lines lc 6 lw 8 dt 4 title at 0.150, 0.902
replot $data using 0:($5/    100        ) with lines lc 7 lw 5 dt 2 title at 0.150, 0.884
replot $data using 0:($6/      1        ) with lines lc 7 lw 5 dt 3 title at 0.150, 0.866

# plot hor axis calendar
replot $data using 0:(0):xticlabel(2) with lines
|
File history
Click on a date/time to view the file as it appeared at that time.
| Date/Time | Thumbnail | Dimensions | User | Comment | |
|---|---|---|---|---|---|
| current | 18:43, 24 September 2020 |  | 3,300 × 1,950 (24 KB) | Jochen Burghardt (talk | contribs) | =={{int:filedesc}}== {{Information |description={{en|1=Diagram of WHO COVID-19 daily data (20 Jan - 16 Aug 2020) for ''"Total Confirmed Cases"'' (thick solid line), its smoothed increment (thick dash-dotted line), ''"Total Deaths"'' (thin dashed line), and its smoothed increment (thin dotted line); see File:WHO_Covid_2020_Jan-Aug_daily_C_Afghanistan.pdf for details.}} |date=2020-09-24 |source={{own}} |author=Jochen Burghardt |permission= |other_versions=[[:File:... |
You cannot overwrite this file.
File usage on Commons
There are no pages that use this file.