File:WHO Covid 2020 Jan-Aug daily C Paraguay.pdf

Size of this JPG preview of this PDF file: 800 × 473 pixels. Other resolutions: 320 × 189 pixels | 640 × 378 pixels | 1,024 × 605 pixels | 1,280 × 756 pixels | 3,300 × 1,950 pixels.
Original file (3,300 × 1,950 pixels, file size: 22 KB, MIME type: application/pdf)
Captions
Captions
Add a one-line explanation of what this file represents
Summary
edit| Description |
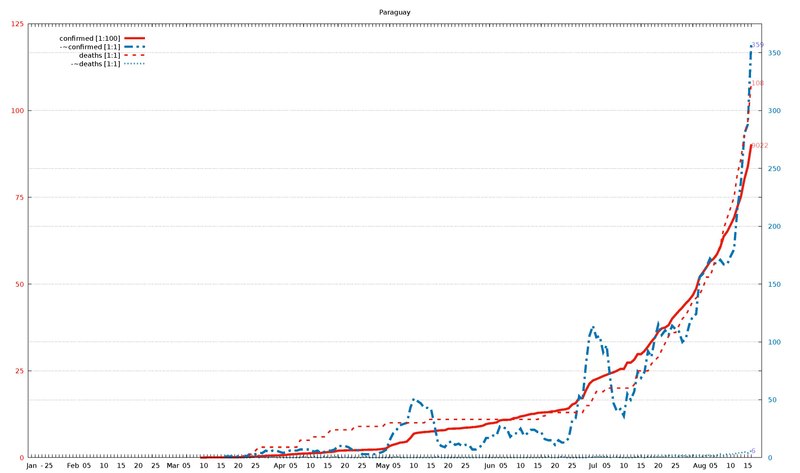
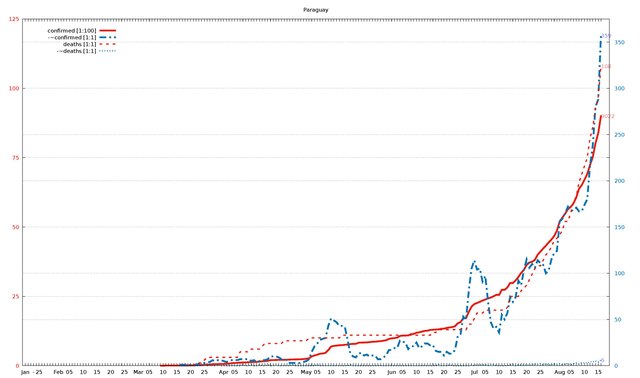
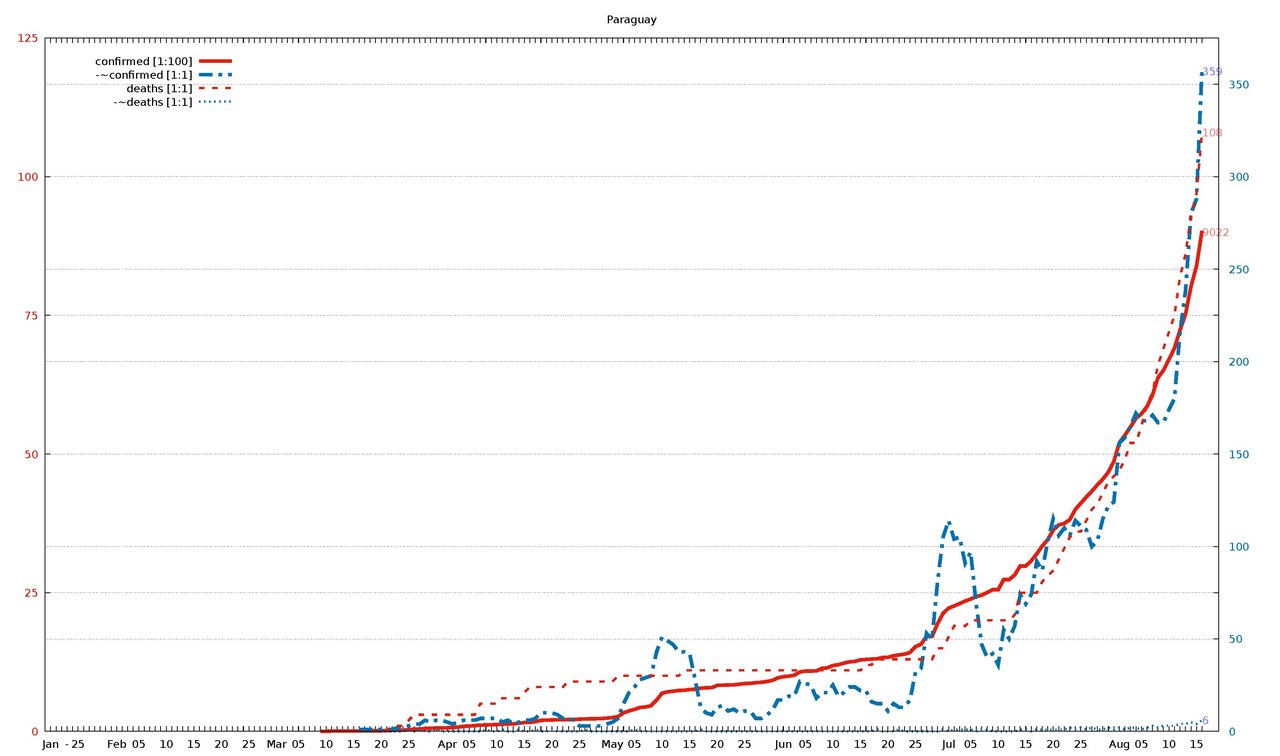
English: Diagram of WHO COVID-19 daily data (20 Jan - 16 Aug 2020) for "Total Confirmed Cases" (thick solid line), its smoothed increment (thick dash-dotted line), "Total Deaths" (thin dashed line) , and its smoothed increment (thin dotted line). Figures are taken from the available situation reports. Red and blue lines refer to the left and right vertical axis, respectively; the scaling factor for each curve is given in the legend. The horizontal axis starts on 20 Jan 2020 (situation report 1), and ends on 16 Aug 2020 (situation report 209). In the smoothed curves, for each day, 1/7 of the difference of the current day's figure and the figure a week ago is shown. For example, in situation report 115 (14 May 2020) and 121 (21 May 2020), there were 8676 and 5339 Total Confirmed Cases in Afghanistan, respectively, so the thick dash-dotted line passes through 477 = (8676-5339)/7 on 21 May.
For an overview of all related visualizations, and a more detailled description, see WHO Covid diagram set#Available country diagrams Jan-Aug 2020 (daily). |
| Date | |
| Source | Own work |
| Author | Jochen Burghardt |
Licensing
editI, the copyright holder of this work, hereby publish it under the following license:
This file is licensed under the Creative Commons Attribution-Share Alike 4.0 International license.
- You are free:
- to share – to copy, distribute and transmit the work
- to remix – to adapt the work
- Under the following conditions:
- attribution – You must give appropriate credit, provide a link to the license, and indicate if changes were made. You may do so in any reasonable manner, but not in any way that suggests the licensor endorses you or your use.
- share alike – If you remix, transform, or build upon the material, you must distribute your contributions under the same or compatible license as the original.
Gnuplot source code
edit| Gnuplot source code |
|---|
set term pdf size 22,13
set term pdf font "sans,20"
set output "WHO_Covid_C_Paraguay.pdf"
set key autotitle columnhead
set termoption noenhanced
# (1) norm: 903 359 108 001
# (2) dist: 1,0:252 2,0:119 2,1:300
# (3,4) dist max: 300 2:108--1:359
# (4) right: 0 1 0 1
# (6,7) scMax: 125 375
# (8) scale: [1:100] [1:1] [1:1] [1:1]


set xrange [-1:212]
set yrange [0:125]
set y2range [0:375]
set xtics 3650,100
set ytics 25 textcolor "#e51e10"
set y2tics 50 textcolor "#0072b2"
set grid y y2

set title "Paraguay"

$data <<EOF
rep day "confirmed [1:100]" "-~confirmed [1:1]" "deaths [1:1]" "-~deaths [1:1]"
1	Jan	.	-	.	-
2	""	.	-	.	-
3	""	.	-	.	-
-	-	-	-	-	-
4	""	.	-	.	-
5	25	.	-	.	-
6	""	.	-	.	-
7	""	.	-	.	-
8	""	.	-	.	-
9	""	.	-	.	-
10	""	.	-	.	-
11	""	.	-	.	-
12	Feb	.	-	.	-
13	""	.	-	.	-
14	""	.	-	.	-
15	""	.	-	.	-
16	05	.	-	.	-
17	""	.	-	.	-
18	""	.	-	.	-
19	""	.	-	.	-
20	""	.	-	.	-
21	10	.	-	.	-
22	""	.	-	.	-
23	""	.	-	.	-
24	""	.	-	.	-
25	""	.	-	.	-
26	15	.	-	.	-
27	""	.	-	.	-
28	""	.	-	.	-
29	""	.	-	.	-
30	""	.	-	.	-
31	20	.	-	.	-
32	""	.	-	.	-
33	""	.	-	.	-
34	""	.	-	.	-
35	""	.	-	.	-
36	25	.	-	.	-
37	""	.	-	.	-
38	""	.	-	.	-
39	""	.	-	.	-
40	""	.	-	.	-
41	Mar	.	-	.	-
42	""	.	-	.	-
43	""	.	-	.	-
44	""	.	-	.	-
45	05	.	-	.	-
46	""	.	-	.	-
47	""	.	-	.	-
48	""	.	-	.	-
49	""	1	-	0	-
50	10	1	-	0	-
51	""	5	-	0	-
52	""	5	-	0	-
53	""	5	-	0	-
54	""	6	-	0	-
55	15	6	-	0	-
56	""	8	1	0	0
57	""	9	1	0	0
58	""	9	1	0	0
59	""	11	1	0	0
60	20	11	1	0	0
61	""	13	1	0	0
62	""	18	1	1	0
63	""	22	2	1	0
64	""	22	2	1	0
65	25	27	3	2	1
66	""	41	4	3	0
67	""	41	4	3	1
68	""	52	6	3	0
69	""	56	5	3	0
70	""	59	6	3	1
71	""	64	6	3	0
72	Apr	65	5	3	0
73	""	69	4	3	0
74	""	77	5	3	0
75	""	92	6	3	0
76	05	96	6	3	0
77	""	104	6	3	0
78	""	113	7	5	0
79	""	115	7	5	1
80	""	119	7	5	0
81	10	124	7	5	0
82	""	129	5	6	1
83	""	133	6	6	0
84	""	134	4	6	0
85	""	147	5	6	1
86	15	159	6	7	0
87	""	161	6	8	0
88	""	174	7	8	1
89	""	199	10	8	0
90	""	202	10	8	0
91	20	206	10	8	1
92	""	208	9	8	0
93	""	208	7	8	0
94	""	213	7	9	0
95	""	213	6	9	0
96	25	220	3	9	0
97	""	223	3	9	1
98	""	228	3	9	0
99	""	228	3	9	0
100	""	230	3	9	0
101	""	239	4	9	0
102	May	249	5	9	0
103	""	266	7	10	0
104	""	333	15	10	0
105	""	370	21	10	0
106	05	396	24	10	1
107	""	431	28	10	0
108	""	440	29	10	0
109	""	462	30	10	0
110	""	563	43	10	0
111	10	689	51	10	0
112	""	713	49	10	0
113	""	724	47	10	0
114	""	737	43	10	0
115	""	740	43	11	0
116	15	754	42	11	0
117	""	759	28	11	0
118	""	778	13	11	1
119	""	786	10	11	0
120	""	788	9	11	0
121	20	829	13	11	0
122	""	833	14	11	0
123	""	836	11	11	0
124	""	838	12	11	0
125	""	850	10	11	0
126	25	862	11	11	0
127	""	865	11	11	0
128	""	877	7	11	0
129	""	884	7	11	0
130	""	900	9	11	0
131	""	917	11	11	0
132	""	964	17	11	0
133	Jun	986	17	11	0
134	""	995	19	11	0
135	""	1013	19	11	0
136	""	1070	27	11	0
137	05	1086	26	11	0
138	""	1087	25	11	0
139	""	1090	18	11	0
140	""	1135	21	11	0
141	""	1145	21	11	0
142	10	1187	25	11	0
143	""	1202	19	11	0
144	""	1230	21	11	0
145	""	1254	24	11	0
146	""	1261	24	11	0
147	15	1289	22	11	0
148	""	1296	22	12	0
149	""	1303	16	12	0
150	""	1308	15	13	1
151	""	1330	15	13	0
152	20	1336	11	13	0
153	""	1362	15	13	0
154	""	1379	13	13	1
155	""	1392	13	13	0
156	""	1422	17	13	0
157	25	1528	32	13	0
158	""	1569	34	13	0
159	""	1711	53	13	0
160	""	1711	50	13	0
161	""	1942	81	15	0
162	""	2127	105	15	1
163	Jul	2221	114	17	0
164	""	2260	104	19	1
165	""	2303	105	19	1
166	""	2349	91	19	1
167	05	2385	97	20	1
168	""	2427	69	20	0
169	""	2456	47	20	1
170	""	2502	40	20	1
171	""	2554	42	20	0
172	10	2554	36	20	0
173	""	2736	55	20	0
174	""	2736	50	20	0
175	""	2820	57	21	0
176	""	2980	74	25	1
177	15	2980	69	25	1
178	""	3074	74	25	0
179	""	3198	92	25	1
180	""	3342	87	27	1
181	""	3457	103	28	1
182	20	3629	115	29	1
183	""	3721	106	31	1
184	""	3748	110	33	1
185	""	3817	106	35	2
186	""	4000	114	36	1
187	25	4113	111	36	2
188	""	4224	109	38	1
189	""	4328	100	40	2
190	""	4444	103	41	1
191	""	4548	115	43	1
192	""	4674	122	45	2
193	""	4866	124	46	1
194	Aug	5207	156	47	2
195	""	5338	159	49	1
196	""	5485	165	52	2
197	""	5644	172	52	2
198	05	5724	168	55	1
199	""	5852	168	59	2
200	""	6060	171	61	3
201	""	6375	167	66	2
202	""	6508	167	69	3
203	10	6705	174	72	3
204	""	6907	180	75	3
205	""	7234	216	82	4
206	""	7519	238	86	4
207	""	8018	280	93	5
208	15	8389	288	97	4
209	""	9022	359	108	6
EOF

# confirmed:
set label "9022   " at first 209, 90           left back textcolor "#ff8080"
# -~confirmed:
set label "359    " at first 209,359*125/375   left back textcolor "#8080ff"
# deaths:
set label "108    " at first 209,108           left back textcolor "#ff8080"
# -~deaths:
set label "6      " at first 209,  6*125/375   left back textcolor "#8080ff"

set multiplot
  plot $data using 0:($3/    100        ) with lines lc 7 lw 8 dt 1 title at 0.150, 0.920
replot $data using 0:($4/      1*125/375) with lines lc 6 lw 8 dt 4 title at 0.150, 0.902
replot $data using 0:($5/      1        ) with lines lc 7 lw 5 dt 2 title at 0.150, 0.884
replot $data using 0:($6/      1*125/375) with lines lc 6 lw 5 dt 3 title at 0.150, 0.866

# plot hor axis calendar
replot $data using 0:(0):xticlabel(2) with lines
|
File history
Click on a date/time to view the file as it appeared at that time.
| Date/Time | Thumbnail | Dimensions | User | Comment | |
|---|---|---|---|---|---|
| current | 19:29, 24 September 2020 |  | 3,300 × 1,950 (22 KB) | Jochen Burghardt (talk | contribs) | =={{int:filedesc}}== {{Information |description={{en|1=Diagram of WHO COVID-19 daily data (20 Jan - 16 Aug 2020) for ''"Total Confirmed Cases"'' (thick solid line), its smoothed increment (thick dash-dotted line), ''"Total Deaths"'' (thin dashed line), and its smoothed increment (thin dotted line); see File:WHO_Covid_2020_Jan-Aug_daily_C_Afghanistan.pdf for details.}} |date=2020-09-24 |source={{own}} |author=Jochen Burghardt |permission= |other_versions=[[:File:... |
You cannot overwrite this file.
File usage on Commons
There are no pages that use this file.