File:WHO Covid 2020 Jan-Aug daily C Qatar.pdf

Size of this JPG preview of this PDF file: 800 × 473 pixels. Other resolutions: 320 × 189 pixels | 640 × 378 pixels | 1,024 × 605 pixels | 1,280 × 756 pixels | 3,300 × 1,950 pixels.
Original file (3,300 × 1,950 pixels, file size: 23 KB, MIME type: application/pdf)
Captions
Captions
Add a one-line explanation of what this file represents
Summary
edit| Description |
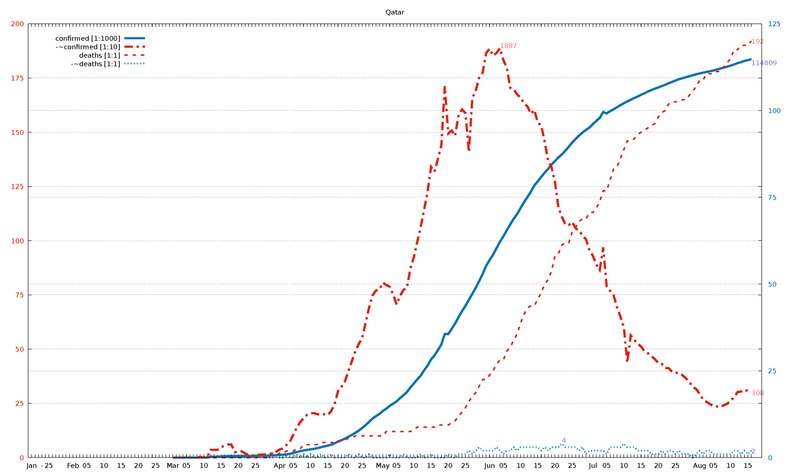
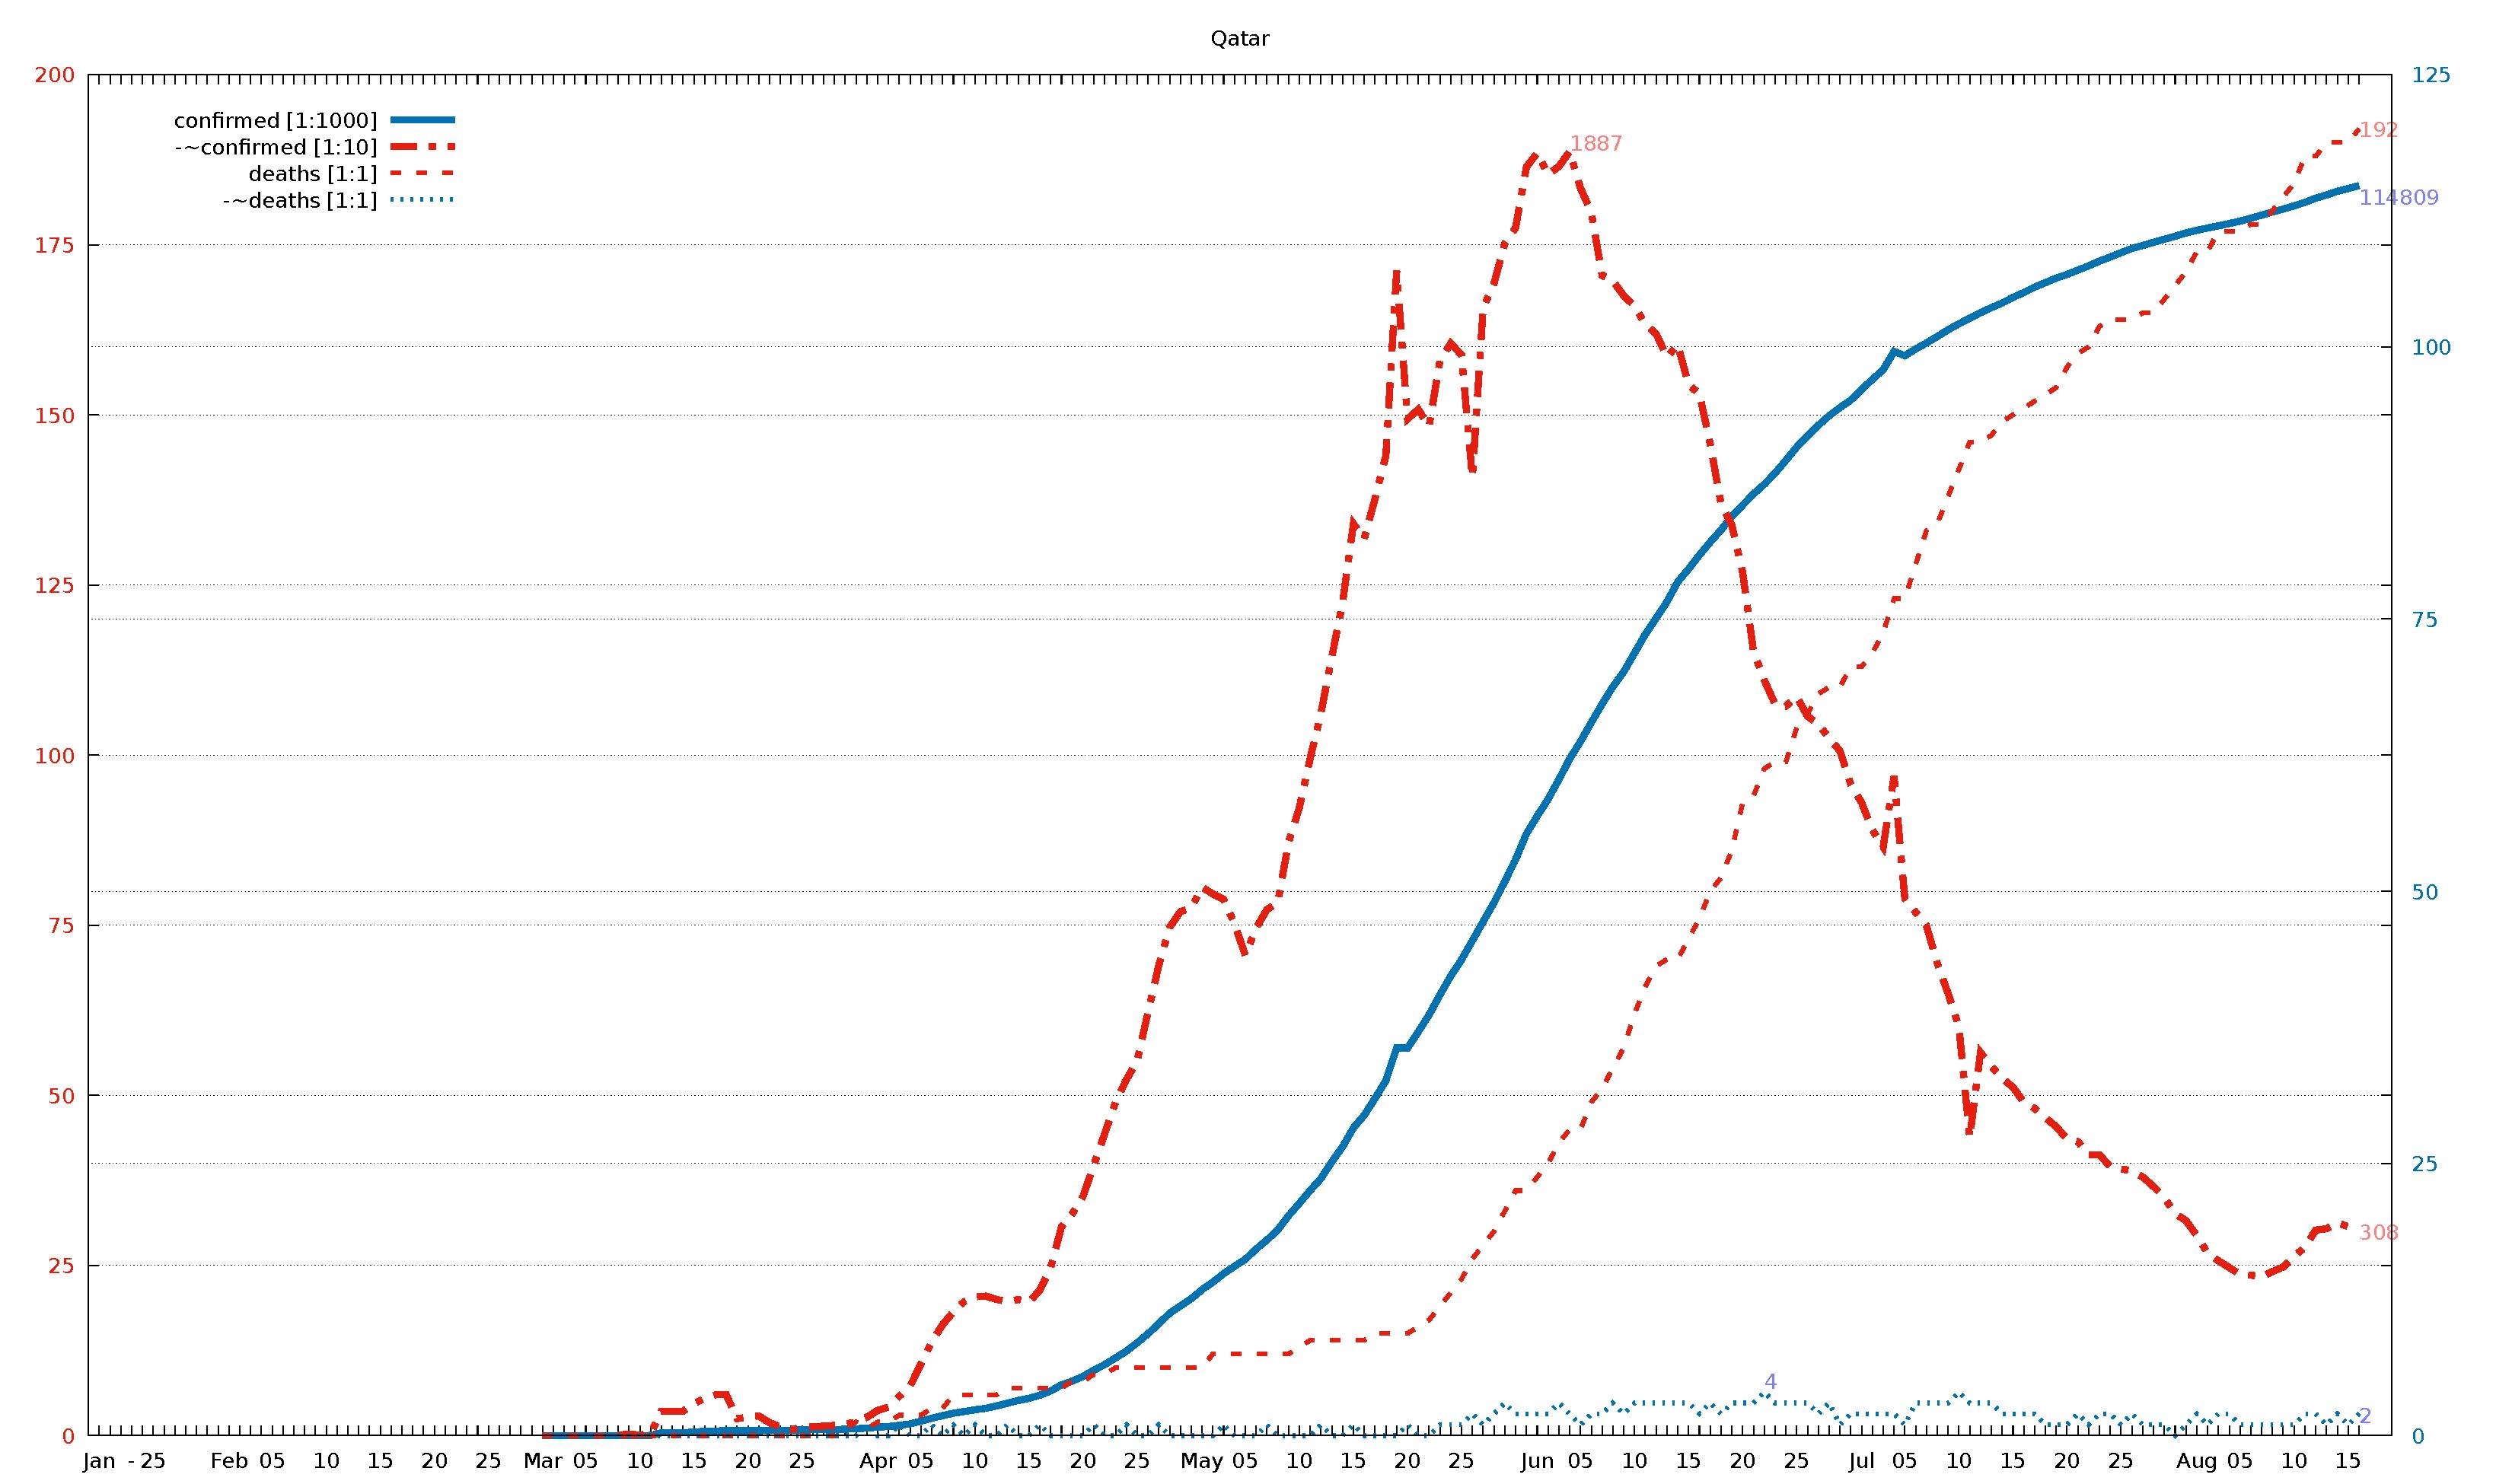
English: Diagram of WHO COVID-19 daily data (20 Jan - 16 Aug 2020) for "Total Confirmed Cases" (thick solid line), its smoothed increment (thick dash-dotted line), "Total Deaths" (thin dashed line) , and its smoothed increment (thin dotted line). Figures are taken from the available situation reports. Red and blue lines refer to the left and right vertical axis, respectively; the scaling factor for each curve is given in the legend. The horizontal axis starts on 20 Jan 2020 (situation report 1), and ends on 16 Aug 2020 (situation report 209). In the smoothed curves, for each day, 1/7 of the difference of the current day's figure and the figure a week ago is shown. For example, in situation report 115 (14 May 2020) and 121 (21 May 2020), there were 8676 and 5339 Total Confirmed Cases in Afghanistan, respectively, so the thick dash-dotted line passes through 477 = (8676-5339)/7 on 21 May.
For an overview of all related visualizations, and a more detailled description, see WHO Covid diagram set#Available country diagrams Jan-Aug 2020 (daily). |
| Date | |
| Source | Own work |
| Author | Jochen Burghardt |
Licensing
editI, the copyright holder of this work, hereby publish it under the following license:
This file is licensed under the Creative Commons Attribution-Share Alike 4.0 International license.
- You are free:
- to share – to copy, distribute and transmit the work
- to remix – to adapt the work
- Under the following conditions:
- attribution – You must give appropriate credit, provide a link to the license, and indicate if changes were made. You may do so in any reasonable manner, but not in any way that suggests the licensor endorses you or your use.
- share alike – If you remix, transform, or build upon the material, you must distribute your contributions under the same or compatible license as the original.
Gnuplot source code
edit| Gnuplot source code |
|---|
set term pdf size 22,13
set term pdf font "sans,20"
set output "WHO_Covid_C_Qatar.pdf"
set key autotitle columnhead
set termoption noenhanced
# (1) norm: 115 189 192 001
# (2) dist: 1,0:165 2,0:167 2,1:102
# (3,4) dist max: 167 2:192--0:115
# (4) right: 1 0 0 1
# (6,7) scMax: 200 125
# (8) scale: [1:1000] [1:10] [1:1] [1:1]


set xrange [-1:212]
set yrange [0:200]
set y2range [0:125]
set xtics 3650,100
set ytics 25 textcolor "#e51e10"
set y2tics 25 textcolor "#0072b2"
set grid y y2

set title "Qatar"

$data <<EOF
rep day "confirmed [1:1000]" "-~confirmed [1:10]" "deaths [1:1]" "-~deaths [1:1]"
1	Jan	.	-	.	-
2	""	.	-	.	-
3	""	.	-	.	-
-	-	-	-	-	-
4	""	.	-	.	-
5	25	.	-	.	-
6	""	.	-	.	-
7	""	.	-	.	-
8	""	.	-	.	-
9	""	.	-	.	-
10	""	.	-	.	-
11	""	.	-	.	-
12	Feb	.	-	.	-
13	""	.	-	.	-
14	""	.	-	.	-
15	""	.	-	.	-
16	05	.	-	.	-
17	""	.	-	.	-
18	""	.	-	.	-
19	""	.	-	.	-
20	""	.	-	.	-
21	10	.	-	.	-
22	""	.	-	.	-
23	""	.	-	.	-
24	""	.	-	.	-
25	""	.	-	.	-
26	15	.	-	.	-
27	""	.	-	.	-
28	""	.	-	.	-
29	""	.	-	.	-
30	""	.	-	.	-
31	20	.	-	.	-
32	""	.	-	.	-
33	""	.	-	.	-
34	""	.	-	.	-
35	""	.	-	.	-
36	25	.	-	.	-
37	""	.	-	.	-
38	""	.	-	.	-
39	""	.	-	.	-
40	""	.	-	.	-
41	Mar	1	-	0	-
42	""	3	-	0	-
43	""	7	-	0	-
44	""	8	-	0	-
45	05	8	-	0	-
46	""	8	-	0	-
47	""	11	-	0	-
48	""	12	1	0	0
49	""	15	2	0	0
50	10	18	1	0	0
51	""	24	3	0	0
52	""	262	36	0	0
53	""	262	36	0	0
54	""	262	36	0	0
55	15	337	47	0	0
56	""	401	55	0	0
57	""	439	60	0	0
58	""	442	60	0	0
59	""	442	25	0	0
60	20	452	27	0	0
61	""	460	29	0	0
62	""	470	19	0	0
63	""	494	13	0	0
64	""	501	9	0	0
65	25	526	12	0	0
66	""	537	13	0	0
67	""	549	14	0	0
68	""	562	15	0	0
69	""	590	17	1	0
70	""	634	20	2	0
71	""	693	27	1	1
72	Apr	781	37	2	0
73	""	835	42	2	0
74	""	949	58	3	1
75	""	1075	73	3	0
76	05	1325	105	3	0
77	""	1604	138	4	1
78	""	1832	163	4	0
79	""	2057	182	6	1
80	""	2210	197	6	0
81	10	2376	204	6	1
82	""	2512	205	6	0
83	""	2728	200	6	0
84	""	2979	197	7	1
85	""	3231	200	7	0
86	15	3428	196	7	0
87	""	3711	214	7	1
88	""	4103	247	7	0
89	""	4663	307	7	0
90	""	5008	326	8	0
91	20	5448	352	8	0
92	""	6015	398	9	1
93	""	6533	444	9	0
94	""	7141	490	10	0
95	""	7764	523	10	1
96	25	8525	551	10	0
97	""	9358	622	10	0
98	""	10287	691	10	1
99	""	11244	747	10	0
100	""	11921	770	10	0
101	""	12564	775	10	0
102	May	13409	806	10	0
103	""	14096	796	12	0
104	""	14872	788	12	1
105	""	15551	752	12	0
106	05	16191	706	12	0
107	""	17142	746	12	0
108	""	17972	773	12	1
109	""	18890	783	12	0
110	""	20201	872	12	0
111	10	21331	923	13	0
112	""	22520	995	14	0
113	""	23623	1062	14	1
114	""	25149	1144	14	0
115	""	26539	1224	14	0
116	15	28272	1340	14	1
117	""	29425	1318	14	0
118	""	30972	1377	15	0
119	""	32604	1440	15	0
120	""	35606	1712	15	0
121	20	35606	1494	15	1
122	""	37097	1508	16	0
123	""	38651	1483	17	0
124	""	40481	1580	19	1
125	""	42213	1605	21	1
126	25	43714	1588	23	1
127	""	45465	1408	26	2
128	""	47207	1657	28	1
129	""	48947	1693	30	2
130	""	50914	1752	33	3
131	""	52907	1775	36	2
132	""	55262	1864	36	2
133	Jun	56910	1885	38	2
134	""	58433	1853	40	2
135	""	60259	1865	43	3
136	""	62160	1887	45	2
137	05	63741	1833	45	1
138	""	65495	1798	49	2
139	""	67195	1705	51	2
140	""	68790	1697	54	3
141	""	70158	1675	57	2
142	10	71879	1660	62	3
143	""	73595	1633	66	3
144	""	75071	1619	69	3
145	""	76588	1585	70	3
146	""	78416	1603	70	3
147	15	79602	1544	73	3
148	""	80876	1531	76	2
149	""	82077	1457	80	3
150	""	83174	1369	82	2
151	""	84441	1338	86	3
152	20	85462	1268	93	3
153	""	86488	1153	94	3
154	""	87369	1110	98	4
155	""	88403	1075	99	3
156	""	89579	1072	99	3
157	25	90778	1086	104	3
158	""	91838	1057	106	3
159	""	92784	1046	109	2
160	""	93663	1025	110	3
161	""	94413	1006	110	1
162	""	95106	957	113	2
163	Jul	96088	930	113	2
164	""	97003	890	115	2
165	""	97897	865	118	2
166	""	99568	969	123	2
167	05	99183	789	123	1
168	""	99799	769	128	3
169	""	100345	749	133	3
170	""	100945	694	134	3
171	""	101553	650	138	3
172	10	102110	601	142	4
173	""	102630	438	146	3
174	""	103128	563	146	3
175	""	103598	543	147	3
176	""	104016	525	149	2
177	15	104533	512	150	2
178	""	104983	490	151	2
179	""	105477	481	152	2
180	""	105898	467	153	1
181	""	106308	454	154	1
182	20	106648	436	157	1
183	""	107037	432	159	2
184	""	107430	413	160	1
185	""	107871	413	163	2
186	""	108244	395	164	2
187	25	108638	392	164	1
188	""	109036	389	164	2
189	""	109305	380	165	1
190	""	109597	366	165	1
191	""	109880	350	167	1
192	""	110153	326	169	0
193	""	110460	316	171	1
194	Aug	110695	294	174	2
195	""	110911	268	174	1
196	""	111107	257	177	2
197	""	111322	247	177	2
198	05	111538	237	177	1
199	""	111805	236	178	1
200	""	112092	233	178	1
201	""	112383	241	180	1
202	""	112650	248	182	1
203	10	112947	263	184	1
204	""	113262	277	188	2
205	""	113646	302	188	2
206	""	113938	304	190	1
207	""	114281	313	190	2
208	15	114532	307	190	1
209	""	114809	308	192	2
EOF

# confirmed:
set label "114809 " at first 209,114*200/125   left back textcolor "#8080ff"
# -~confirmed:
set label "308    " at first 209, 30           left back textcolor "#ff8080"
set label "1887   " at first 136,188        +2 left back textcolor "#ff8080"
# deaths:
set label "192    " at first 209,192           left back textcolor "#ff8080"
# -~deaths:
set label "2      " at first 209,  2*200/125   left back textcolor "#8080ff"
set label "4      " at first 154,  4*200/125+2 left back textcolor "#8080ff"

set multiplot
  plot $data using 0:($3/   1000*200/125) with lines lc 6 lw 8 dt 1 title at 0.150, 0.920
replot $data using 0:($4/     10        ) with lines lc 7 lw 8 dt 4 title at 0.150, 0.902
replot $data using 0:($5/      1        ) with lines lc 7 lw 5 dt 2 title at 0.150, 0.884
replot $data using 0:($6/      1*200/125) with lines lc 6 lw 5 dt 3 title at 0.150, 0.866

# plot hor axis calendar
replot $data using 0:(0):xticlabel(2) with lines
|
File history
Click on a date/time to view the file as it appeared at that time.
| Date/Time | Thumbnail | Dimensions | User | Comment | |
|---|---|---|---|---|---|
| current | 19:31, 24 September 2020 |  | 3,300 × 1,950 (23 KB) | Jochen Burghardt (talk | contribs) | =={{int:filedesc}}== {{Information |description={{en|1=Diagram of WHO COVID-19 daily data (20 Jan - 16 Aug 2020) for ''"Total Confirmed Cases"'' (thick solid line), its smoothed increment (thick dash-dotted line), ''"Total Deaths"'' (thin dashed line), and its smoothed increment (thin dotted line); see File:WHO_Covid_2020_Jan-Aug_daily_C_Afghanistan.pdf for details.}} |date=2020-09-24 |source={{own}} |author=Jochen Burghardt |permission= |other_versions=[[:File:... |
You cannot overwrite this file.
File usage on Commons
There are no pages that use this file.