File:WHO Covid 2020 Jan-Aug daily C R Korea.pdf

Size of this JPG preview of this PDF file: 800 × 473 pixels. Other resolutions: 320 × 189 pixels | 640 × 378 pixels | 1,024 × 605 pixels | 1,280 × 756 pixels | 3,300 × 1,950 pixels.
Original file (3,300 × 1,950 pixels, file size: 25 KB, MIME type: application/pdf)
Captions
Captions
Add a one-line explanation of what this file represents
Summary
edit| Description |
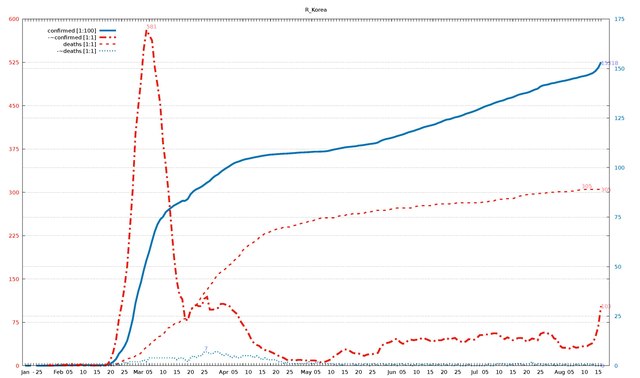
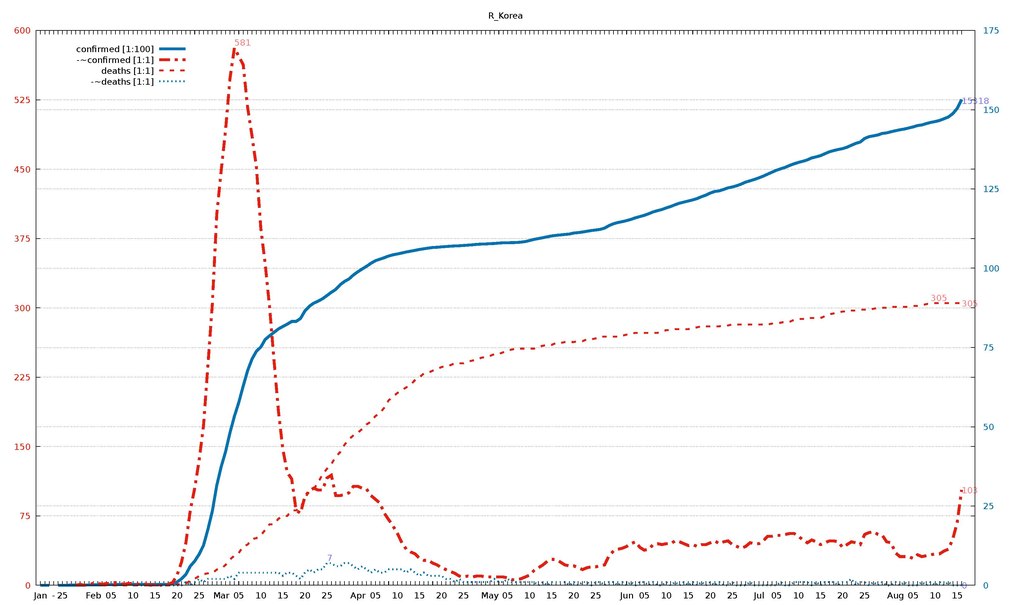
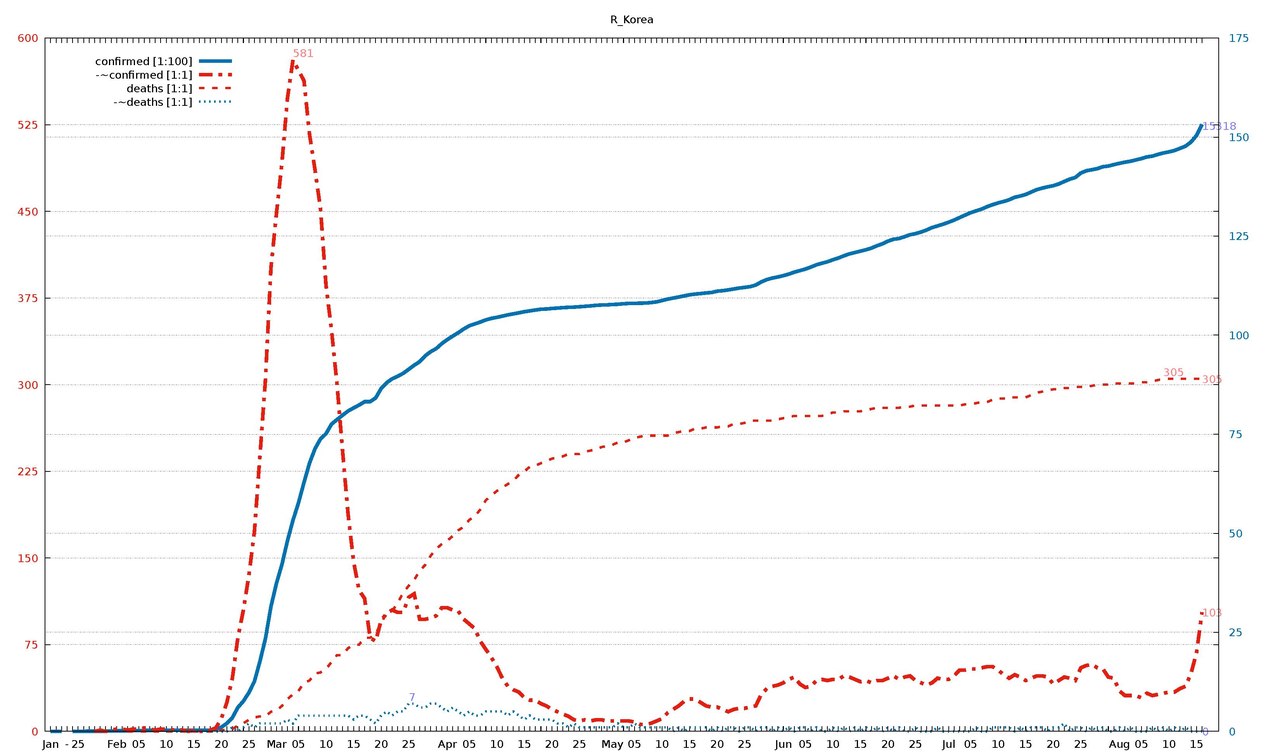
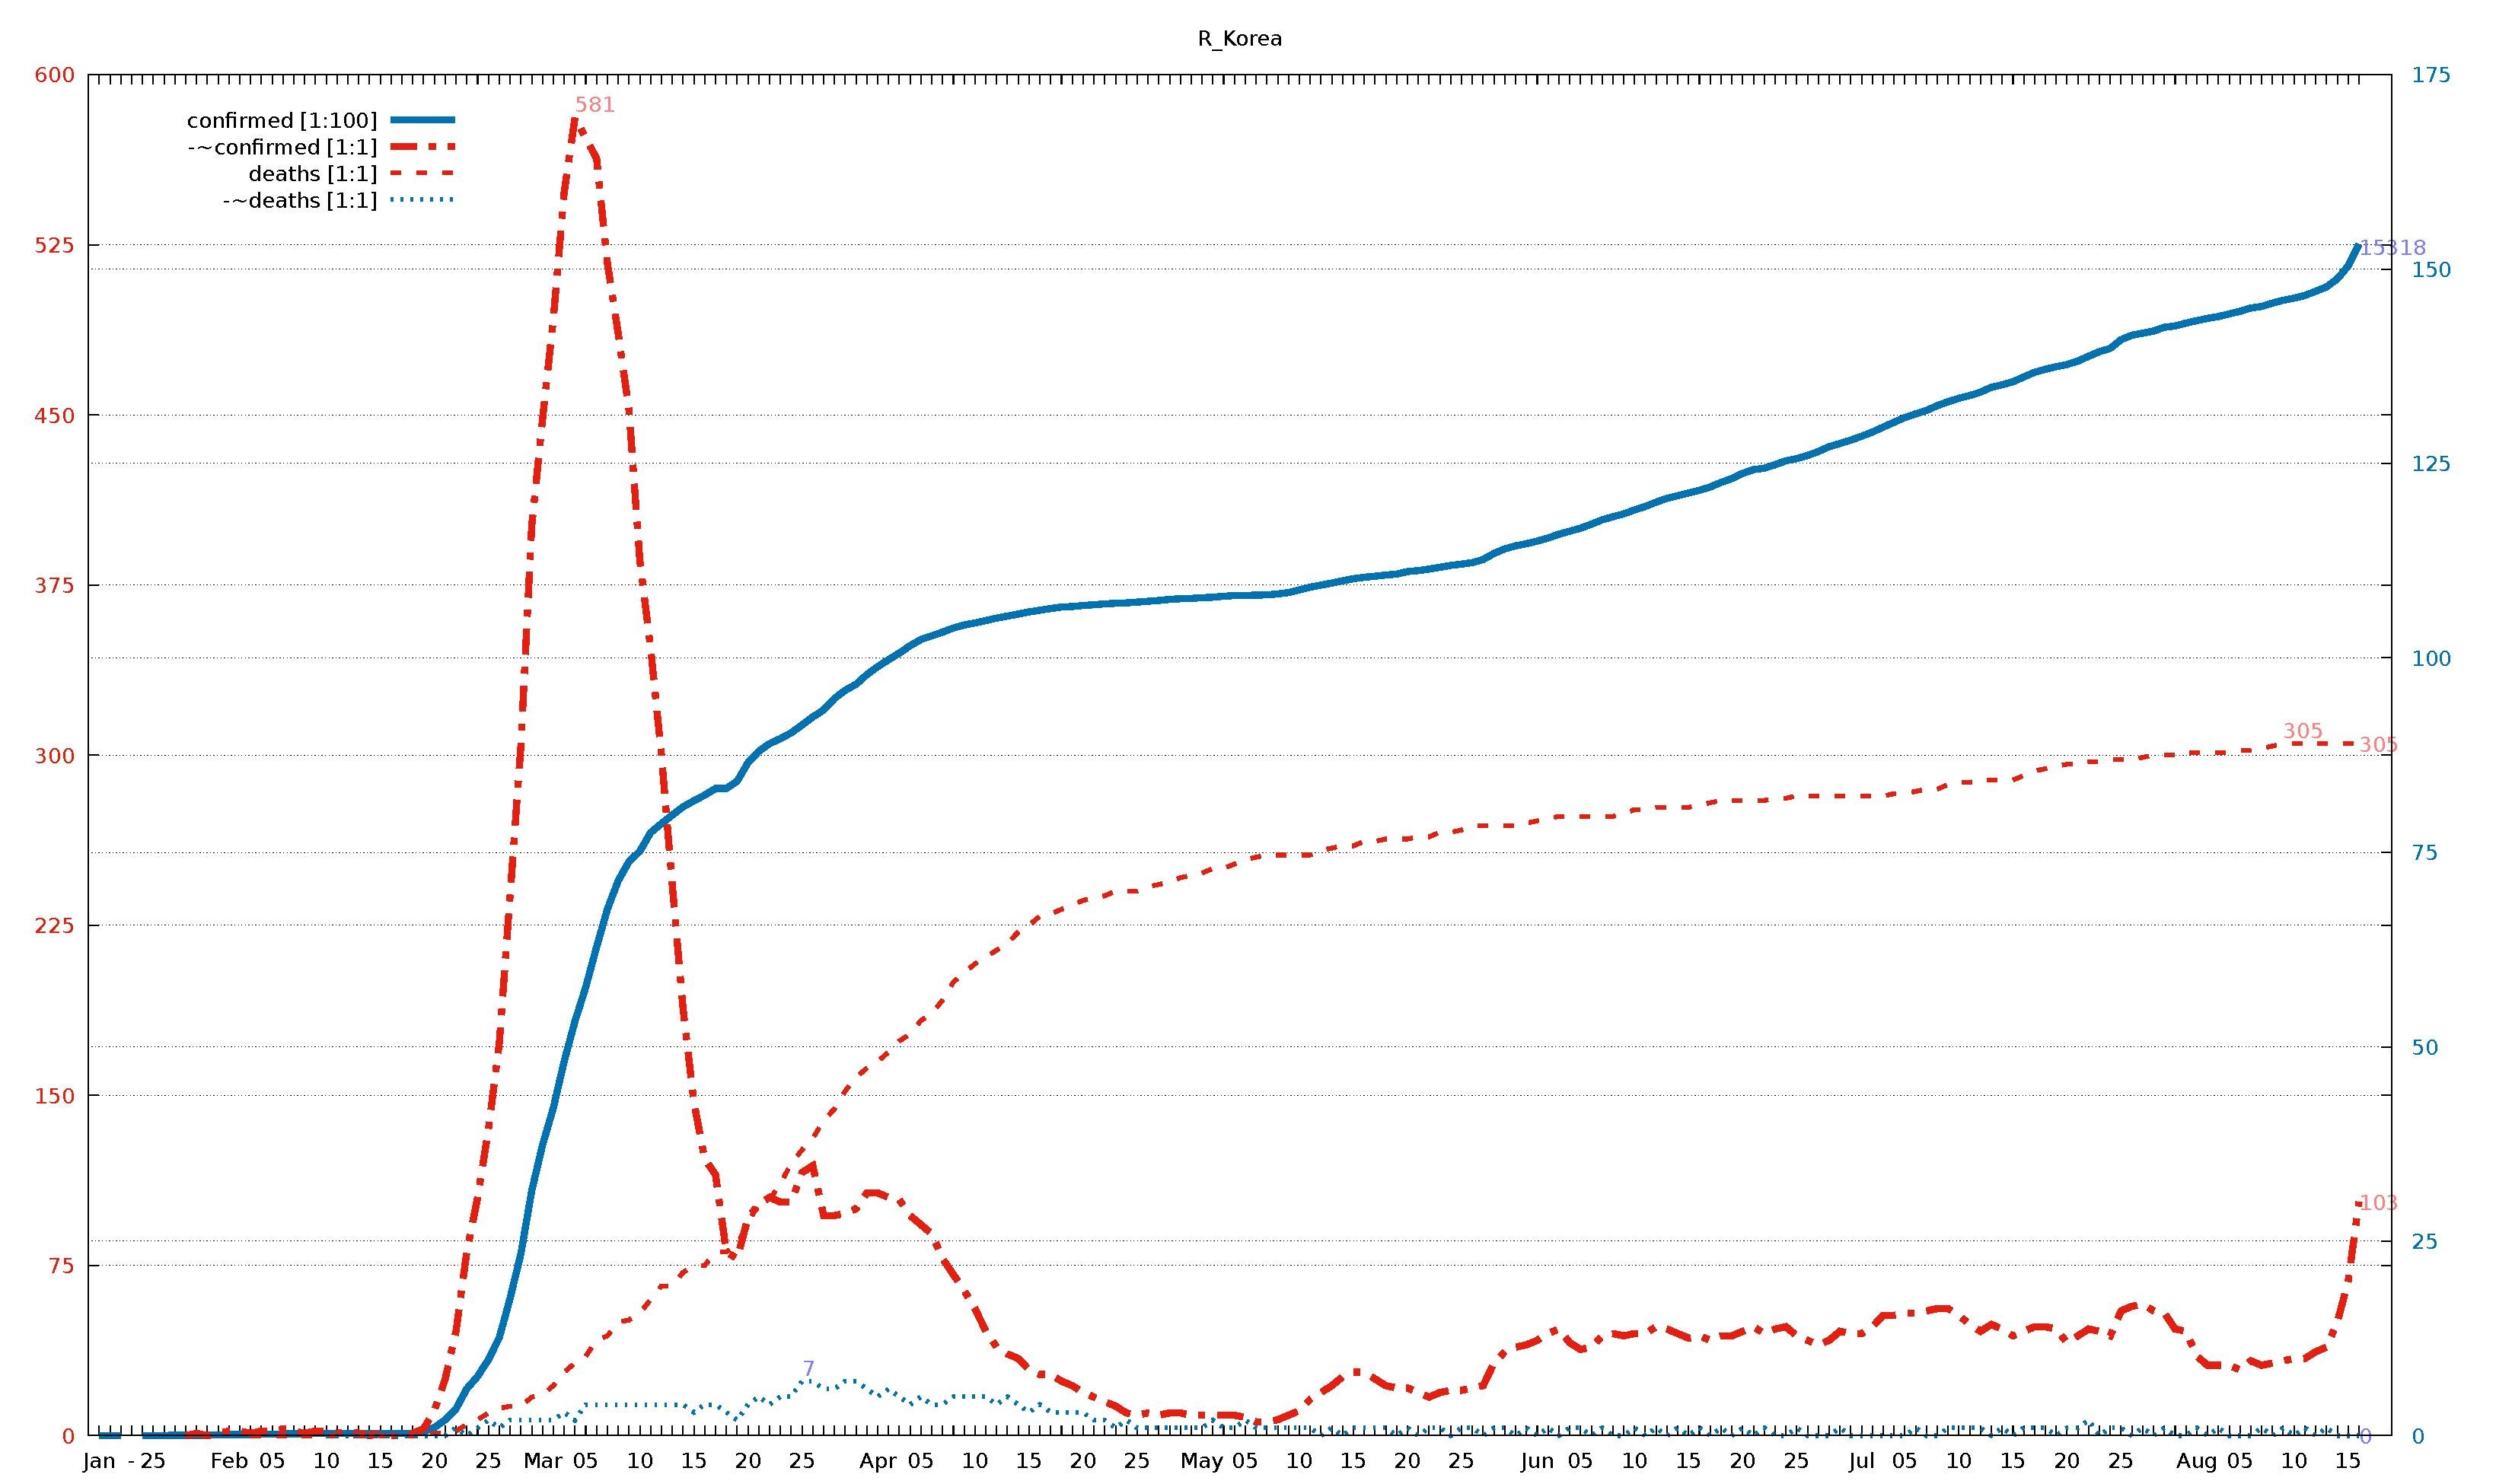
English: Diagram of WHO COVID-19 daily data (20 Jan - 16 Aug 2020) for "Total Confirmed Cases" (thick solid line), its smoothed increment (thick dash-dotted line), "Total Deaths" (thin dashed line) , and its smoothed increment (thin dotted line). Figures are taken from the available situation reports. Red and blue lines refer to the left and right vertical axis, respectively; the scaling factor for each curve is given in the legend. The horizontal axis starts on 20 Jan 2020 (situation report 1), and ends on 16 Aug 2020 (situation report 209). In the smoothed curves, for each day, 1/7 of the difference of the current day's figure and the figure a week ago is shown. For example, in situation report 115 (14 May 2020) and 121 (21 May 2020), there were 8676 and 5339 Total Confirmed Cases in Afghanistan, respectively, so the thick dash-dotted line passes through 477 = (8676-5339)/7 on 21 May.
For an overview of all related visualizations, and a more detailled description, see WHO Covid diagram set#Available country diagrams Jan-Aug 2020 (daily). |
| Date | |
| Source | Own work |
| Author | Jochen Burghardt |
Licensing
editI, the copyright holder of this work, hereby publish it under the following license:
This file is licensed under the Creative Commons Attribution-Share Alike 4.0 International license.
- You are free:
- to share – to copy, distribute and transmit the work
- to remix – to adapt the work
- Under the following conditions:
- attribution – You must give appropriate credit, provide a link to the license, and indicate if changes were made. You may do so in any reasonable manner, but not in any way that suggests the licensor endorses you or your use.
- share alike – If you remix, transform, or build upon the material, you must distribute your contributions under the same or compatible license as the original.
Gnuplot source code
edit| Gnuplot source code |
|---|
set term pdf size 22,13
set term pdf font "sans,20"
set output "WHO_Covid_C_R_Korea.pdf"
set key autotitle columnhead
set termoption noenhanced
# (1) norm: 154 581 305 001
# (2) dist: 1,0:265 2,0:198 2,1:191
# (3,4) dist max: 265 1:581--0:154
# (4) right: 1 0 0 1
# (6,7) scMax: 600 175
# (8) scale: [1:100] [1:1] [1:1] [1:1]


set xrange [-1:212]
set yrange [0:600]
set y2range [0:175]
set xtics 3650,100
set ytics 75 textcolor "#e51e10"
set y2tics 25 textcolor "#0072b2"
set grid y y2

set title "R_Korea"

$data <<EOF
rep day "confirmed [1:100]" "-~confirmed [1:1]" "deaths [1:1]" "-~deaths [1:1]"
1	Jan	1	-	.	-
2	""	1	-	.	-
3	""	1	-	.	-
-	-	-	-	-	-
4	""	2	-	.	-
5	25	2	-	.	-
6	""	2	-	.	-
7	""	4	-	.	-
8	""	4	0	.	-
9	""	4	1	.	-
10	""	4	0	.	-
11	""	11	1	.	-
12	Feb	12	2	.	-
13	""	15	2	.	-
14	""	15	1	0	-
15	""	16	2	0	-
16	05	18	2	0	-
17	""	23	3	0	-
18	""	24	2	0	-
19	""	24	1	0	-
20	""	27	2	0	-
21	10	27	2	0	0
22	""	28	1	0	0
23	""	28	2	0	0
24	""	28	1	0	0
25	""	28	0	0	0
26	15	28	1	0	0
27	""	29	0	0	0
28	""	30	0	0	0
29	""	31	1	0	0
30	""	51	3	0	0
31	20	104	11	1	0
32	""	204	25	1	0
33	""	346	46	2	1
34	""	602	81	5	0
35	""	763	105	7	1
36	25	977	135	10	2
37	""	1261	173	12	1
38	""	1766	238	13	2
39	""	2337	304	13	2
40	""	3150	401	17	2
41	Mar	3736	448	18	2
42	""	4212	492	22	2
43	""	4812	548	28	3
44	""	5328	581	32	2
45	05	5766	572	35	4
46	""	6284	563	42	4
47	""	6767	517	44	4
48	""	7134	486	50	4
49	""	7382	452	51	4
50	10	7513	386	54	4
51	""	7755	347	60	4
52	""	7869	300	66	4
53	""	7979	243	66	4
54	""	8086	188	72	4
55	15	8162	147	75	3
56	""	8236	122	75	4
57	""	8320	115	81	4
58	""	8320	81	81	3
59	""	8413	78	84	2
60	20	8652	96	94	4
61	""	8799	102	102	5
62	""	8897	105	104	4
63	""	8961	103	111	5
64	""	9037	103	120	5
65	25	9137	116	126	7
66	""	9241	119	131	7
67	""	9332	97	139	6
68	""	9478	97	144	6
69	""	9583	98	152	7
70	""	9661	100	158	7
71	""	9786	107	162	6
72	Apr	9887	107	165	5
73	""	9976	105	169	6
74	""	10062	104	174	5
75	""	10156	97	177	4
76	05	10237	93	183	5
77	""	10284	89	186	4
78	""	10331	78	192	4
79	""	10384	71	200	5
80	""	10423	64	204	5
81	10	10450	56	208	5
82	""	10480	46	211	5
83	""	10512	39	214	4
84	""	10537	36	217	5
85	""	10564	34	222	4
86	15	10591	29	225	3
87	""	10613	27	229	4
88	""	10635	27	230	3
89	""	10653	24	232	3
90	""	10661	22	234	3
91	20	10674	19	236	3
92	""	10683	17	237	2
93	""	10694	15	238	2
94	""	10702	13	240	1
95	""	10708	10	240	2
96	25	10718	9	240	1
97	""	10728	10	242	1
98	""	10738	9	243	1
99	""	10752	10	244	1
100	""	10761	10	246	1
101	""	10765	9	247	1
102	May	10774	9	248	1
103	""	10780	9	250	2
104	""	10793	9	250	1
105	""	10801	9	252	1
106	05	10804	8	254	2
107	""	10806	6	255	1
108	""	10810	6	256	1
109	""	10822	7	256	1
110	""	10840	9	256	1
111	10	10874	11	256	1
112	""	10909	16	256	1
113	""	10936	19	258	0
114	""	10962	22	259	1
115	""	10991	26	260	0
116	15	11018	28	260	1
117	""	11037	28	262	1
118	""	11050	25	262	1
119	""	11065	22	263	1
120	""	11078	21	263	0
121	20	11110	21	263	1
122	""	11122	19	264	0
123	""	11142	17	264	1
124	""	11165	19	266	1
125	""	11190	20	266	0
126	25	11206	20	267	1
127	""	11225	21	269	1
128	""	11265	22	269	0
129	""	11344	32	269	1
130	""	11402	37	269	1
131	""	11441	39	269	0
132	""	11468	40	270	1
133	Jun	11503	42	271	0
134	""	11541	45	272	1
135	""	11590	47	273	0
136	""	11629	41	273	1
137	05	11668	38	273	1
138	""	11719	39	273	0
139	""	11776	44	273	1
140	""	11814	45	273	0
141	""	11852	44	274	0
142	10	11902	45	276	1
143	""	11947	45	276	0
144	""	12003	48	277	1
145	""	12051	47	277	0
146	""	12085	45	277	1
147	15	12121	43	277	0
148	""	12155	44	278	1
149	""	12198	42	279	0
150	""	12257	44	280	1
151	""	12306	44	280	0
152	20	12373	46	280	1
153	""	12421	48	280	0
154	""	12438	45	280	1
155	""	12484	47	281	0
156	""	12535	48	281	0
157	25	12563	44	282	1
158	""	12602	42	282	0
159	""	12653	40	282	0
160	""	12715	42	282	0
161	""	12757	46	282	1
162	""	12800	45	282	0
163	Jul	12850	45	282	0
164	""	12904	48	282	0
165	""	12967	53	282	0
166	""	13030	53	283	0
167	05	13091	54	283	0
168	""	13137	54	284	1
169	""	13181	55	285	0
170	""	13244	56	285	0
171	""	13293	56	287	1
172	10	13338	53	288	1
173	""	13373	49	288	1
174	""	13417	46	289	1
175	""	13479	49	289	0
176	""	13512	47	289	1
177	15	13551	44	289	0
178	""	13612	46	291	1
179	""	13672	48	293	1
180	""	13711	48	294	1
181	""	13745	47	295	0
182	20	13771	41	296	1
183	""	13816	44	296	1
184	""	13879	47	297	2
185	""	13938	46	297	0
186	""	13979	44	298	1
187	25	14092	55	298	1
188	""	14150	57	298	0
189	""	14175	58	299	1
190	""	14203	55	300	0
191	""	14251	54	300	1
192	""	14269	47	300	0
193	""	14305	46	301	0
194	Aug	14336	35	301	1
195	""	14366	31	301	0
196	""	14389	31	301	1
197	""	14423	31	301	0
198	05	14456	29	302	0
199	""	14499	33	302	0
200	""	14519	31	303	1
201	""	14562	32	304	0
202	""	14598	33	305	1
203	10	14626	34	305	0
204	""	14660	34	305	1
205	""	14714	37	305	0
206	""	14770	39	305	1
207	""	14873	50	305	0
208	15	15039	68	305	0
209	""	15318	103	305	0
EOF

# confirmed:
set label "15318  " at first 209,153*600/175   left back textcolor "#8080ff"
# -~confirmed:
set label "103    " at first 209,103           left back textcolor "#ff8080"
set label "581    " at first  44,581        +6 left back textcolor "#ff8080"
# deaths:
set label "305    " at first 209,305           left back textcolor "#ff8080"
set label "305    " at first 202,305        +6 left back textcolor "#ff8080"
# -~deaths:
set label "0      " at first 209,  0*600/175   left back textcolor "#8080ff"
set label "7      " at first  65,  7*600/175+6 left back textcolor "#8080ff"

set multiplot
  plot $data using 0:($3/    100*600/175) with lines lc 6 lw 8 dt 1 title at 0.150, 0.920
replot $data using 0:($4/      1        ) with lines lc 7 lw 8 dt 4 title at 0.150, 0.902
replot $data using 0:($5/      1        ) with lines lc 7 lw 5 dt 2 title at 0.150, 0.884
replot $data using 0:($6/      1*600/175) with lines lc 6 lw 5 dt 3 title at 0.150, 0.866

# plot hor axis calendar
replot $data using 0:(0):xticlabel(2) with lines
|
File history
Click on a date/time to view the file as it appeared at that time.
| Date/Time | Thumbnail | Dimensions | User | Comment | |
|---|---|---|---|---|---|
| current | 19:31, 24 September 2020 |  | 3,300 × 1,950 (25 KB) | Jochen Burghardt (talk | contribs) | =={{int:filedesc}}== {{Information |description={{en|1=Diagram of WHO COVID-19 daily data (20 Jan - 16 Aug 2020) for ''"Total Confirmed Cases"'' (thick solid line), its smoothed increment (thick dash-dotted line), ''"Total Deaths"'' (thin dashed line), and its smoothed increment (thin dotted line); see File:WHO_Covid_2020_Jan-Aug_daily_C_Afghanistan.pdf for details.}} |date=2020-09-24 |source={{own}} |author=Jochen Burghardt |permission= |other_versions=[[:File:... |
You cannot overwrite this file.
File usage on Commons
There are no pages that use this file.