File:WHO Covid 2020 Jan-Aug daily C South Sudan.pdf

Size of this JPG preview of this PDF file: 800 × 473 pixels. Other resolutions: 320 × 189 pixels | 640 × 378 pixels | 1,024 × 605 pixels | 1,280 × 756 pixels | 3,300 × 1,950 pixels.
Original file (3,300 × 1,950 pixels, file size: 21 KB, MIME type: application/pdf)
Captions
Captions
Add a one-line explanation of what this file represents
Summary
edit| Description |
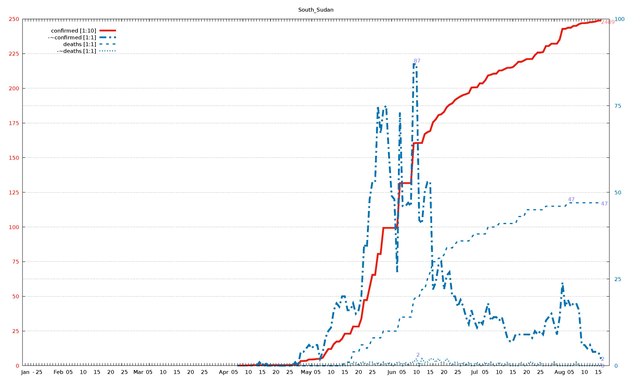
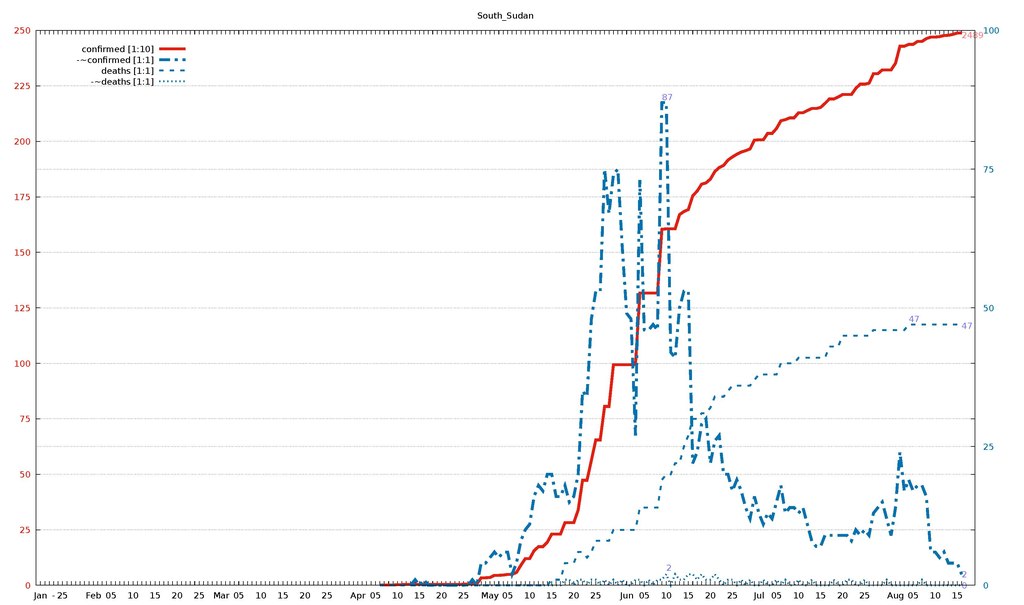
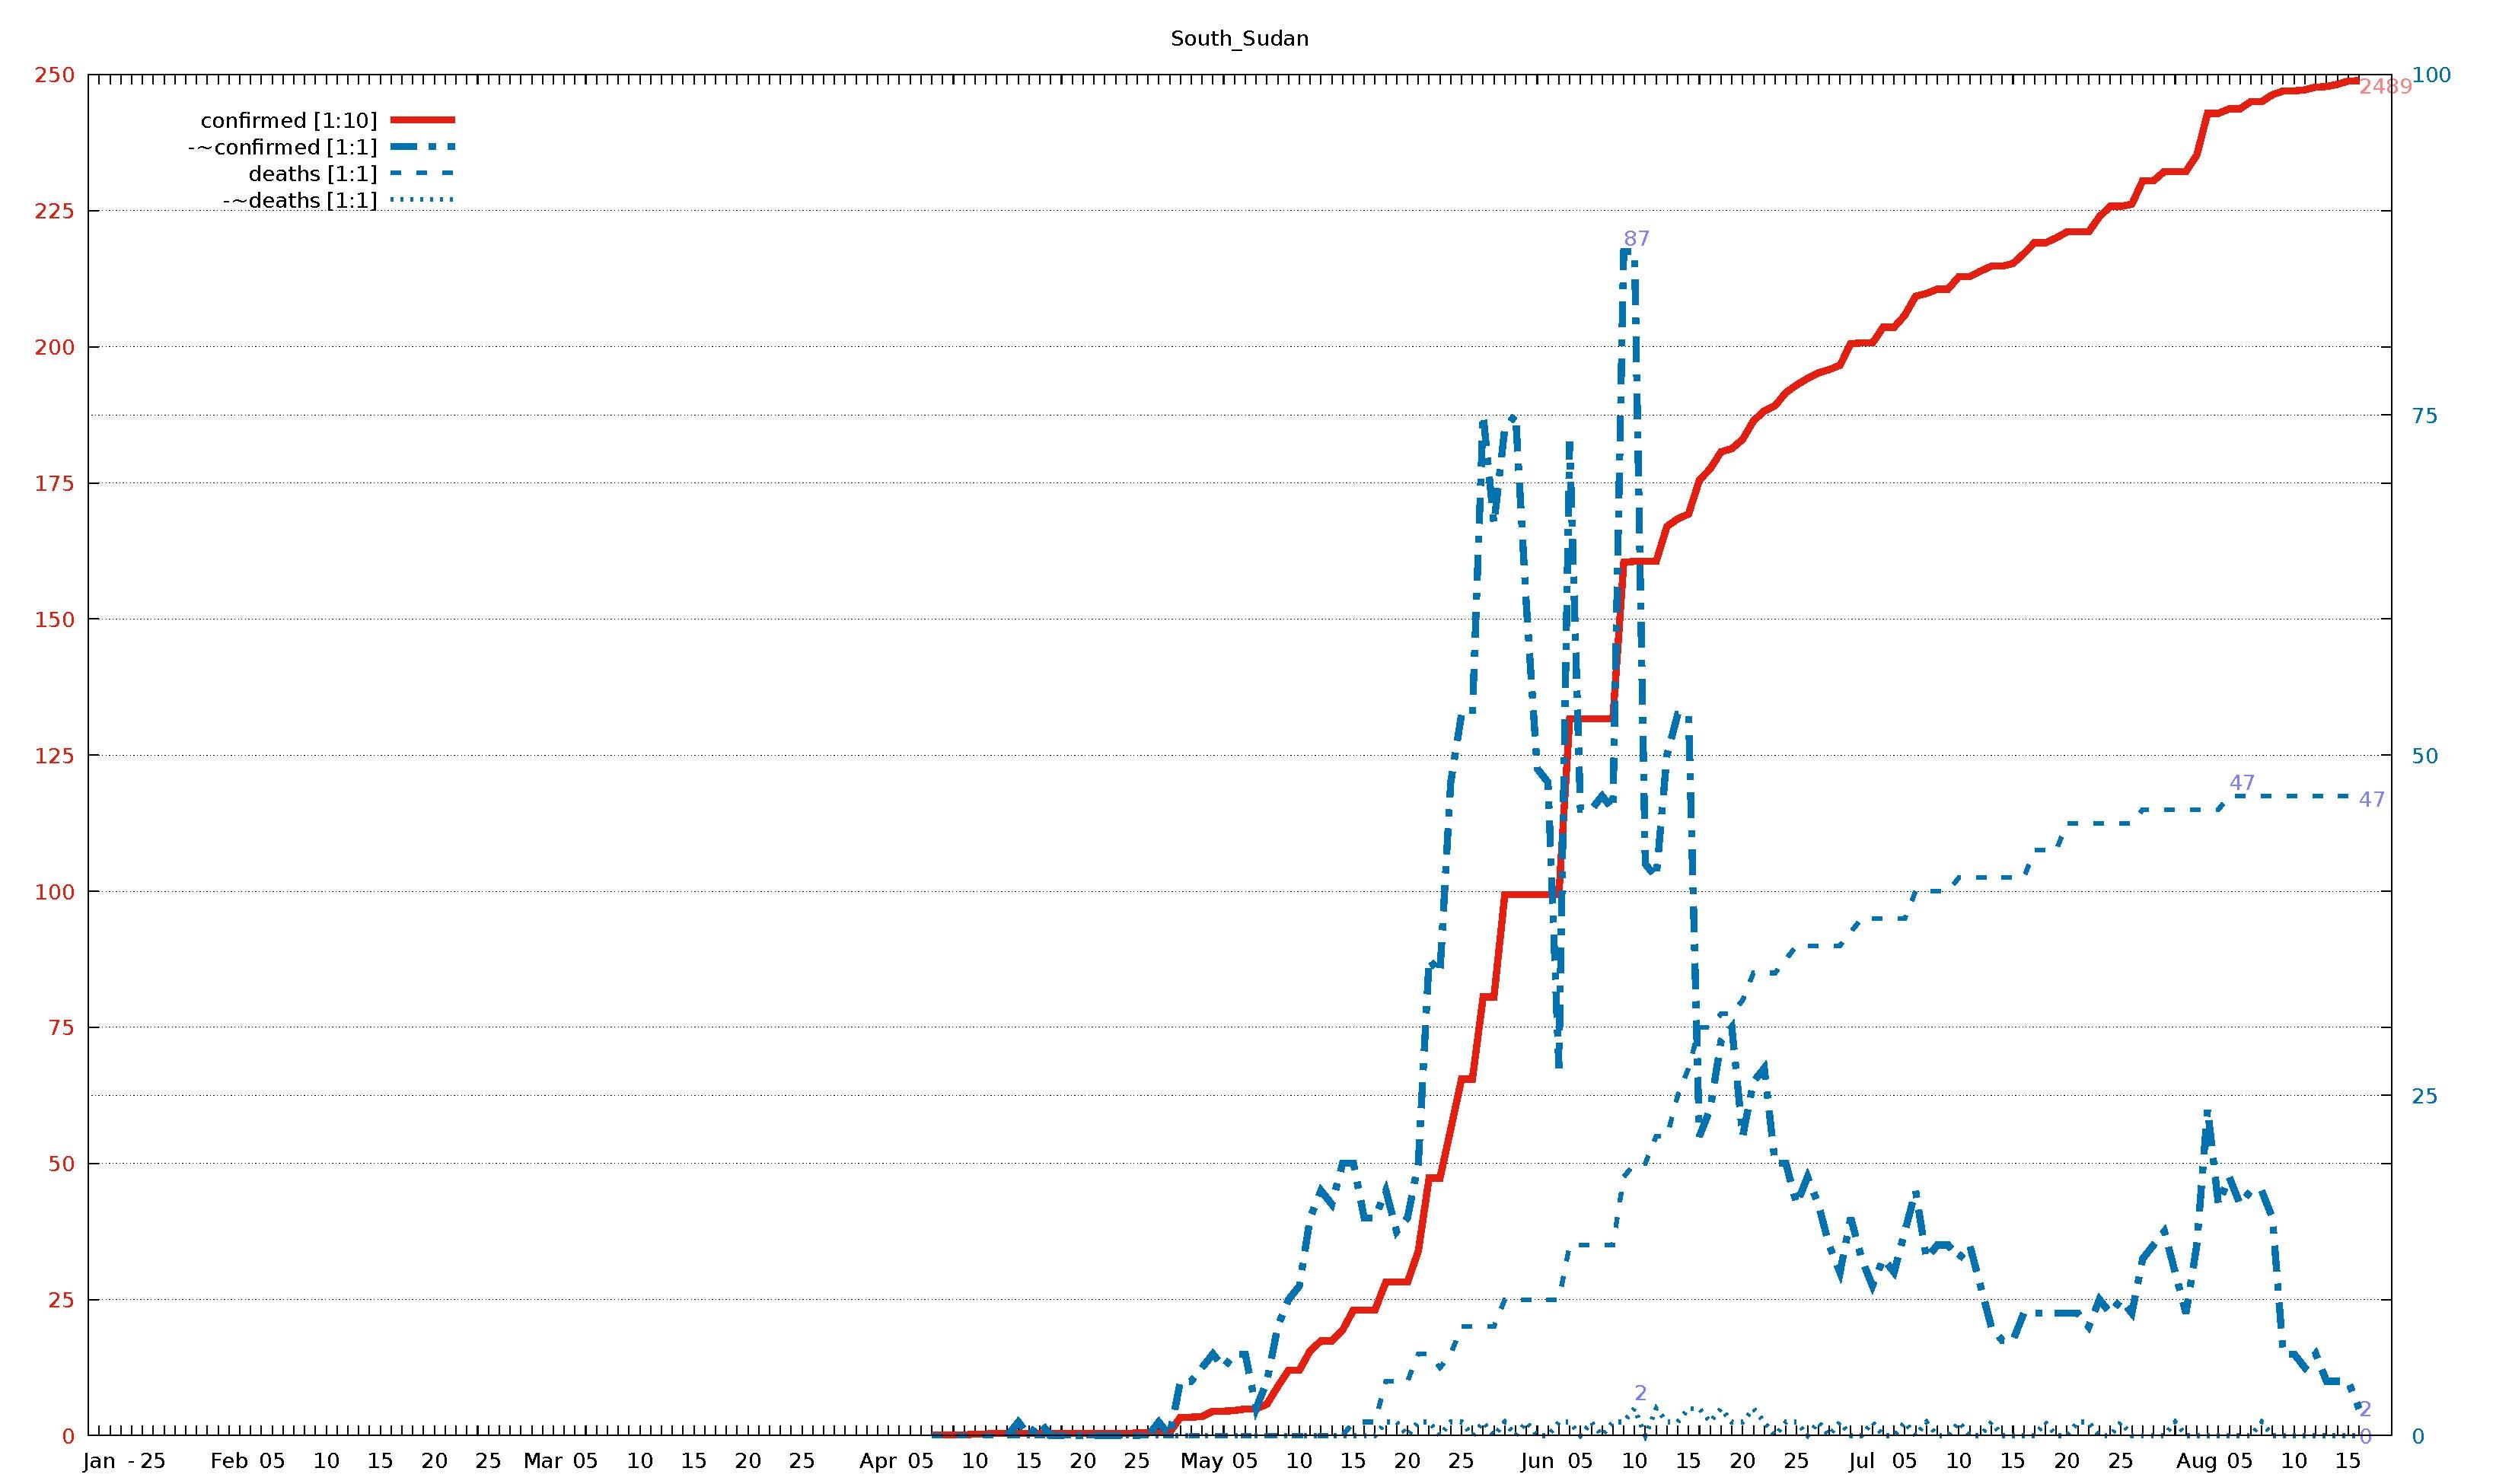
English: Diagram of WHO COVID-19 daily data (20 Jan - 16 Aug 2020) for "Total Confirmed Cases" (thick solid line), its smoothed increment (thick dash-dotted line), "Total Deaths" (thin dashed line) , and its smoothed increment (thin dotted line). Figures are taken from the available situation reports. Red and blue lines refer to the left and right vertical axis, respectively; the scaling factor for each curve is given in the legend. The horizontal axis starts on 20 Jan 2020 (situation report 1), and ends on 16 Aug 2020 (situation report 209). In the smoothed curves, for each day, 1/7 of the difference of the current day's figure and the figure a week ago is shown. For example, in situation report 115 (14 May 2020) and 121 (21 May 2020), there were 8676 and 5339 Total Confirmed Cases in Afghanistan, respectively, so the thick dash-dotted line passes through 477 = (8676-5339)/7 on 21 May.
For an overview of all related visualizations, and a more detailled description, see WHO Covid diagram set#Available country diagrams Jan-Aug 2020 (daily). |
| Date | |
| Source | Own work |
| Author | Jochen Burghardt |
Licensing
editI, the copyright holder of this work, hereby publish it under the following license:
This file is licensed under the Creative Commons Attribution-Share Alike 4.0 International license.
- You are free:
- to share – to copy, distribute and transmit the work
- to remix – to adapt the work
- Under the following conditions:
- attribution – You must give appropriate credit, provide a link to the license, and indicate if changes were made. You may do so in any reasonable manner, but not in any way that suggests the licensor endorses you or your use.
- share alike – If you remix, transform, or build upon the material, you must distribute your contributions under the same or compatible license as the original.
Gnuplot source code
edit| Gnuplot source code |
|---|
set term pdf size 22,13
set term pdf font "sans,20"
set output "WHO_Covid_C_South_Sudan.pdf"
set key autotitle columnhead
set termoption noenhanced
# (1) norm: 249 001 001 001

set xrange [-1:212]
set yrange [0:250]
set y2range [0:100]
set xtics 3650,100
set ytics 25 textcolor "#e51e10"
set y2tics 25 textcolor "#0072b2"
set grid y y2

set title "South_Sudan"

$data <<EOF
rep day "confirmed [1:10]" "-~confirmed [1:1]" "deaths [1:1]" "-~deaths [1:1]"
1	Jan	.	-	.	-
2	""	.	-	.	-
3	""	.	-	.	-
-	-	-	-	-	-
4	""	.	-	.	-
5	25	.	-	.	-
6	""	.	-	.	-
7	""	.	-	.	-
8	""	.	-	.	-
9	""	.	-	.	-
10	""	.	-	.	-
11	""	.	-	.	-
12	Feb	.	-	.	-
13	""	.	-	.	-
14	""	.	-	.	-
15	""	.	-	.	-
16	05	.	-	.	-
17	""	.	-	.	-
18	""	.	-	.	-
19	""	.	-	.	-
20	""	.	-	.	-
21	10	.	-	.	-
22	""	.	-	.	-
23	""	.	-	.	-
24	""	.	-	.	-
25	""	.	-	.	-
26	15	.	-	.	-
27	""	.	-	.	-
28	""	.	-	.	-
29	""	.	-	.	-
30	""	.	-	.	-
31	20	.	-	.	-
32	""	.	-	.	-
33	""	.	-	.	-
34	""	.	-	.	-
35	""	.	-	.	-
36	25	.	-	.	-
37	""	.	-	.	-
38	""	.	-	.	-
39	""	.	-	.	-
40	""	.	-	.	-
41	Mar	.	-	.	-
42	""	.	-	.	-
43	""	.	-	.	-
44	""	.	-	.	-
45	05	.	-	.	-
46	""	.	-	.	-
47	""	.	-	.	-
48	""	.	-	.	-
49	""	.	-	.	-
50	10	.	-	.	-
51	""	.	-	.	-
52	""	.	-	.	-
53	""	.	-	.	-
54	""	.	-	.	-
55	15	.	-	.	-
56	""	.	-	.	-
57	""	.	-	.	-
58	""	.	-	.	-
59	""	.	-	.	-
60	20	.	-	.	-
61	""	.	-	.	-
62	""	.	-	.	-
63	""	.	-	.	-
64	""	.	-	.	-
65	25	.	-	.	-
66	""	.	-	.	-
67	""	.	-	.	-
68	""	.	-	.	-
69	""	.	-	.	-
70	""	.	-	.	-
71	""	.	-	.	-
72	Apr	.	-	.	-
73	""	.	-	.	-
74	""	.	-	.	-
75	""	.	-	.	-
76	05	.	-	.	-
77	""	1	-	0	-
78	""	1	-	0	-
79	""	1	-	0	-
80	""	1	-	0	-
81	10	3	-	0	-
82	""	3	-	0	-
83	""	4	-	0	-
84	""	4	0	0	0
85	""	4	1	0	0
86	15	4	0	0	0
87	""	4	1	0	0
88	""	4	0	0	0
89	""	4	0	0	0
90	""	4	0	0	0
91	20	4	0	0	0
92	""	4	0	0	0
93	""	4	0	0	0
94	""	4	0	0	0
95	""	4	0	0	0
96	25	5	0	0	0
97	""	5	0	0	0
98	""	6	1	0	0
99	""	6	0	0	0
100	""	34	4	0	0
101	""	34	4	0	0
102	May	35	5	0	0
103	""	45	6	0	0
104	""	45	5	0	0
105	""	46	6	0	0
106	05	49	6	0	0
107	""	49	2	0	0
108	""	58	4	0	0
109	""	90	8	0	0
110	""	120	10	0	0
111	10	120	11	0	0
112	""	156	16	0	0
113	""	174	18	0	0
114	""	174	17	0	0
115	""	194	20	0	0
116	15	231	20	1	0
117	""	231	16	1	0
118	""	231	16	1	0
119	""	282	18	4	1
120	""	282	15	4	1
121	20	282	16	4	0
122	""	339	20	6	1
123	""	473	35	6	1
124	""	473	34	5	0
125	""	563	48	6	1
126	25	655	53	8	1
127	""	655	53	8	0
128	""	806	75	8	1
129	""	806	67	8	0
130	""	994	74	10	1
131	""	994	75	10	0
132	""	994	61	10	1
133	Jun	994	49	10	0
134	""	994	48	10	0
135	""	994	27	10	1
136	""	1317	73	14	1
137	05	1317	46	14	0
138	""	1317	46	14	1
139	""	1317	47	14	0
140	""	1317	46	14	1
141	""	1604	87	19	1
142	10	1606	87	20	2
143	""	1606	42	20	0
144	""	1606	41	22	2
145	""	1670	50	22	1
146	""	1684	53	25	1
147	15	1693	53	27	2
148	""	1755	22	30	2
149	""	1776	24	30	1
150	""	1807	29	31	2
151	""	1813	30	31	1
152	20	1830	22	32	1
153	""	1864	26	34	2
154	""	1882	27	34	1
155	""	1892	20	34	0
156	""	1916	20	35	1
157	25	1930	17	36	1
158	""	1942	19	36	0
159	""	1952	17	36	1
160	""	1958	14	36	0
161	""	1966	12	36	1
162	""	2006	16	37	0
163	Jul	2007	13	38	0
164	""	2007	11	38	1
165	""	2036	13	38	0
166	""	2036	12	38	0
167	05	2058	15	38	1
168	""	2093	18	40	0
169	""	2098	13	40	1
170	""	2106	14	40	0
171	""	2106	14	40	0
172	10	2129	13	41	1
173	""	2129	14	41	0
174	""	2139	11	41	0
175	""	2148	8	41	1
176	""	2148	7	41	0
177	15	2153	7	41	0
178	""	2171	9	41	0
179	""	2191	9	43	0
180	""	2191	9	43	1
181	""	2200	9	43	0
182	20	2211	9	45	0
183	""	2211	9	45	1
184	""	2211	8	45	1
185	""	2239	10	45	0
186	""	2258	9	45	0
187	25	2258	10	45	1
188	""	2262	9	45	0
189	""	2305	13	46	0
190	""	2305	14	46	0
191	""	2322	15	46	0
192	""	2322	12	46	1
193	""	2322	9	46	0
194	Aug	2352	14	46	0
195	""	2429	24	46	0
196	""	2429	17	46	0
197	""	2437	19	47	0
198	05	2437	17	47	0
199	""	2450	18	47	0
200	""	2450	18	47	1
201	""	2463	16	47	0
202	""	2470	6	47	0
203	10	2470	6	47	0
204	""	2472	5	47	0
205	""	2477	6	47	0
206	""	2478	4	47	0
207	""	2482	4	47	0
208	15	2488	4	47	0
209	""	2489	2	47	0
EOF

# confirmed:
set label "2489   " at first 209,248           left back textcolor "#ff8080"
# -~confirmed:
set label "2      " at first 209,  2*250/100   left back textcolor "#8080ff"
set label "87     " at first 141, 87*250/100+3 left back textcolor "#8080ff"
# deaths:
set label "47     " at first 209, 47*250/100   left back textcolor "#8080ff"
set label "47     " at first 197, 47*250/100+3 left back textcolor "#8080ff"
# -~deaths:
set label "0      " at first 209,  0*250/100   left back textcolor "#8080ff"
set label "2      " at first 142,  2*250/100+3 left back textcolor "#8080ff"

set multiplot
  plot $data using 0:($3/     10        ) with lines lc 7 lw 8 dt 1 title at 0.150, 0.920
replot $data using 0:($4/      1*250/100) with lines lc 6 lw 8 dt 4 title at 0.150, 0.902
replot $data using 0:($5/      1*250/100) with lines lc 6 lw 5 dt 2 title at 0.150, 0.884
replot $data using 0:($6/      1*250/100) with lines lc 6 lw 5 dt 3 title at 0.150, 0.866

# plot hor axis calendar
replot $data using 0:(0):xticlabel(2) with lines
|
File history
Click on a date/time to view the file as it appeared at that time.
| Date/Time | Thumbnail | Dimensions | User | Comment | |
|---|---|---|---|---|---|
| current | 19:36, 24 September 2020 |  | 3,300 × 1,950 (21 KB) | Jochen Burghardt (talk | contribs) | =={{int:filedesc}}== {{Information |description={{en|1=Diagram of WHO COVID-19 daily data (20 Jan - 16 Aug 2020) for ''"Total Confirmed Cases"'' (thick solid line), its smoothed increment (thick dash-dotted line), ''"Total Deaths"'' (thin dashed line), and its smoothed increment (thin dotted line); see File:WHO_Covid_2020_Jan-Aug_daily_C_Afghanistan.pdf for details.}} |date=2020-09-24 |source={{own}} |author=Jochen Burghardt |permission= |other_versions=[[:File:... |
You cannot overwrite this file.
File usage on Commons
There are no pages that use this file.