File:WHO Covid 2020 Jan-Aug daily C Switzerland.pdf

Size of this JPG preview of this PDF file: 800 × 473 pixels. Other resolutions: 320 × 189 pixels | 640 × 378 pixels | 1,024 × 605 pixels | 1,280 × 756 pixels | 3,300 × 1,950 pixels.
Original file (3,300 × 1,950 pixels, file size: 25 KB, MIME type: application/pdf)
Captions
Captions
Add a one-line explanation of what this file represents
Summary
edit| Description |
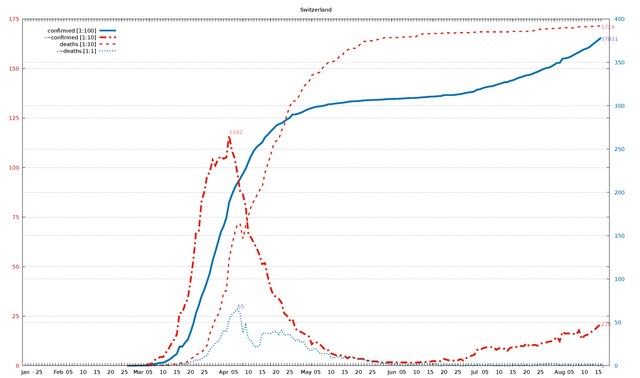
English: Diagram of WHO COVID-19 daily data (20 Jan - 16 Aug 2020) for "Total Confirmed Cases" (thick solid line), its smoothed increment (thick dash-dotted line), "Total Deaths" (thin dashed line) , and its smoothed increment (thin dotted line). Figures are taken from the available situation reports. Red and blue lines refer to the left and right vertical axis, respectively; the scaling factor for each curve is given in the legend. The horizontal axis starts on 20 Jan 2020 (situation report 1), and ends on 16 Aug 2020 (situation report 209). In the smoothed curves, for each day, 1/7 of the difference of the current day's figure and the figure a week ago is shown. For example, in situation report 115 (14 May 2020) and 121 (21 May 2020), there were 8676 and 5339 Total Confirmed Cases in Afghanistan, respectively, so the thick dash-dotted line passes through 477 = (8676-5339)/7 on 21 May.
For an overview of all related visualizations, and a more detailled description, see WHO Covid diagram set#Available country diagrams Jan-Aug 2020 (daily). |
| Date | |
| Source | Own work |
| Author | Jochen Burghardt |
Licensing
editI, the copyright holder of this work, hereby publish it under the following license:
This file is licensed under the Creative Commons Attribution-Share Alike 4.0 International license.
- You are free:
- to share – to copy, distribute and transmit the work
- to remix – to adapt the work
- Under the following conditions:
- attribution – You must give appropriate credit, provide a link to the license, and indicate if changes were made. You may do so in any reasonable manner, but not in any way that suggests the licensor endorses you or your use.
- share alike – If you remix, transform, or build upon the material, you must distribute your contributions under the same or compatible license as the original.
Gnuplot source code
edit| Gnuplot source code |
|---|
set term pdf size 22,13
set term pdf font "sans,20"
set output "WHO_Covid_C_Switzerland.pdf"
set key autotitle columnhead
set termoption noenhanced
# (1) norm: 379 117 172 001
# (2) dist: 1,0:308 2,0:221 2,1:147
# (3,4) dist max: 308 1:117--0:379
# (4) right: 1 0 0 1
# (6,7) scMax: 175 400
# (8) scale: [1:100] [1:10] [1:10] [1:1]


set xrange [-1:212]
set yrange [0:175]
set y2range [0:400]
set xtics 3650,100
set ytics 25 textcolor "#e51e10"
set y2tics 50 textcolor "#0072b2"
set grid y y2

set title "Switzerland"

$data <<EOF
rep day "confirmed [1:100]" "-~confirmed [1:10]" "deaths [1:10]" "-~deaths [1:1]"
1	Jan	.	-	.	-
2	""	.	-	.	-
3	""	.	-	.	-
-	-	-	-	-	-
4	""	.	-	.	-
5	25	.	-	.	-
6	""	.	-	.	-
7	""	.	-	.	-
8	""	.	-	.	-
9	""	.	-	.	-
10	""	.	-	.	-
11	""	.	-	.	-
12	Feb	.	-	.	-
13	""	.	-	.	-
14	""	.	-	.	-
15	""	.	-	.	-
16	05	.	-	.	-
17	""	.	-	.	-
18	""	.	-	.	-
19	""	.	-	.	-
20	""	.	-	.	-
21	10	.	-	.	-
22	""	.	-	.	-
23	""	.	-	.	-
24	""	.	-	.	-
25	""	.	-	.	-
26	15	.	-	.	-
27	""	.	-	.	-
28	""	.	-	.	-
29	""	.	-	.	-
30	""	.	-	.	-
31	20	.	-	.	-
32	""	.	-	.	-
33	""	.	-	.	-
34	""	.	-	.	-
35	""	.	-	.	-
36	25	.	-	.	-
37	""	1	-	0	-
38	""	1	-	0	-
39	""	6	-	0	-
40	""	10	-	0	-
41	Mar	18	-	0	-
42	""	24	-	0	-
43	""	30	-	0	-
44	""	37	5	0	0
45	05	56	8	0	0
46	""	86	11	1	0
47	""	209	29	1	0
48	""	264	35	2	1
49	""	332	44	2	0
50	10	332	43	2	0
51	""	491	65	3	1
52	""	645	84	4	0
53	""	858	110	6	1
54	""	1125	131	6	1
55	15	1359	157	11	1
56	""	2200	266	13	1
57	""	2200	267	14	2
58	""	2650	309	14	2
59	""	3010	338	21	2
60	20	3863	429	33	4
61	""	4840	531	43	5
62	""	6077	674	56	7
63	""	6971	681	60	6
64	""	8015	831	66	8
65	25	8789	877	86	10
66	""	9714	958	103	12
67	""	10714	978	161	18
68	""	12104	1038	197	22
69	""	13152	1011	235	26
70	""	14274	1043	257	28
71	""	15412	1057	295	33
72	Apr	16108	1045	373	41
73	""	17070	1051	378	39
74	""	18844	1162	536	53
75	""	19706	1086	607	59
76	05	20489	1048	666	62
77	""	21065	970	715	65
78	""	21574	880	715	60
79	""	22164	865	641	38
80	""	22710	806	705	47
81	10	23495	664	756	31
82	""	24228	646	805	29
83	""	24820	619	831	23
84	""	25220	594	858	21
85	""	25499	560	885	24
86	15	25753	513	900	37
87	""	26336	518	973	38
88	""	26651	451	1016	37
89	""	26997	396	1058	37
90	""	27322	357	1110	39
91	20	27658	348	1134	40
92	""	27862	338	1141	36
93	""	27981	318	1186	41
94	""	28186	264	1216	35
95	""	28414	252	1267	36
96	25	28595	229	1308	36
97	""	28978	236	1336	32
98	""	28978	189	1336	29
99	""	29081	174	1352	30
100	""	29181	171	1379	27
101	""	29324	163	1407	28
102	May	29503	155	1422	22
103	""	29622	147	1434	18
104	""	29734	108	1466	18
105	""	29822	121	1472	20
106	05	29898	116	1476	18
107	""	29926	107	1482	14
108	""	29977	93	1504	14
109	""	30043	77	1517	14
110	""	30168	78	1531	14
111	10	30168	62	1531	9
112	""	30222	57	1537	9
113	""	30261	52	1542	10
114	""	30297	53	1560	11
115	""	30330	51	1563	8
116	15	30380	48	1588	10
117	""	30431	37	1594	9
118	""	30489	46	1601	10
119	""	30504	41	1602	10
120	""	30514	36	1602	8
121	20	30535	34	1613	8
122	""	30575	35	1629	9
123	""	30611	33	1637	7
124	""	30624	27	1637	6
125	""	30642	22	1640	6
126	25	30653	21	1640	5
127	""	30663	22	1641	6
128	""	30678	20	1647	5
129	""	30693	17	1648	2
130	""	30713	15	1654	3
131	""	30745	17	1656	3
132	""	30762	17	1656	2
133	Jun	30779	18	1656	2
134	""	30788	18	1656	2
135	""	30791	16	1656	2
136	""	30810	17	1659	1
137	05	30830	16	1659	1
138	""	30853	16	1659	0
139	""	30873	16	1660	1
140	""	30882	14	1660	0
141	""	30889	15	1660	1
142	10	30905	16	1662	1
143	""	30928	17	1674	2
144	""	30961	19	1674	2
145	""	30980	18	1676	3
146	""	31011	20	1676	2
147	15	31034	21	1676	2
148	""	31048	23	1676	2
149	""	31063	23	1677	3
150	""	31100	24	1677	0
151	""	31117	22	1677	0
152	20	31217	34	1680	1
153	""	31217	30	1680	1
154	""	31217	26	1680	0
155	""	31217	24	1680	1
156	""	31249	27	1679	0
157	25	31293	27	1681	1
158	""	31345	33	1681	0
159	""	31403	26	1681	0
160	""	31472	37	1681	0
161	""	31534	45	1681	1
162	""	31569	50	1681	0
163	Jul	31631	55	1683	0
164	""	31851	80	1684	1
165	""	31884	77	1685	0
166	""	32017	87	1685	1
167	05	32114	92	1685	0
168	""	32184	93	1685	1
169	""	32230	94	1685	1
170	""	32284	94	1685	0
171	""	32413	80	1685	0
172	10	32501	88	1685	0
173	""	32605	84	1685	0
174	""	32713	86	1685	0
175	""	32713	75	1685	0
176	""	32861	90	1685	0
177	15	32931	93	1687	0
178	""	33063	93	1687	1
179	""	33205	100	1687	0
180	""	33296	99	1687	0
181	""	33406	99	1687	0
182	20	33504	113	1687	1
183	""	33547	98	1687	0
184	""	33655	103	1690	0
185	""	33796	105	1692	1
186	""	33913	101	1693	1
187	25	34067	110	1699	2
188	""	34215	116	1699	1
189	""	34325	117	1700	2
190	""	34390	121	1700	2
191	""	34522	123	1702	2
192	""	34714	132	1702	1
193	""	34933	145	1703	2
194	Aug	34933	124	1703	0
195	""	35412	171	1707	1
196	""	35461	162	1706	1
197	""	35527	163	1706	1
198	05	35657	162	1705	1
199	""	35838	160	1705	0
200	""	36019	156	1708	1
201	""	36180	178	1711	1
202	""	36362	135	1711	0
203	10	36514	151	1711	1
204	""	36619	156	1711	1
205	""	36806	164	1712	1
206	""	37079	177	1713	1
207	""	37312	185	1714	1
208	15	37580	200	1715	0
209	""	37831	210	1714	1
EOF

# confirmed:
set label "37831  " at first 209,378*175/400   left back textcolor "#8080ff"
# -~confirmed:
set label "210    " at first 209, 21           left back textcolor "#ff8080"
set label "1162   " at first  74,116        +2 left back textcolor "#ff8080"
# deaths:
set label "1714   " at first 209,171           left back textcolor "#ff8080"
# -~deaths:
set label "1      " at first 209,  1*175/400   left back textcolor "#8080ff"
set label "65     " at first  77, 65*175/400+2 left back textcolor "#8080ff"

set multiplot
  plot $data using 0:($3/    100*175/400) with lines lc 6 lw 8 dt 1 title at 0.150, 0.920
replot $data using 0:($4/     10        ) with lines lc 7 lw 8 dt 4 title at 0.150, 0.902
replot $data using 0:($5/     10        ) with lines lc 7 lw 5 dt 2 title at 0.150, 0.884
replot $data using 0:($6/      1*175/400) with lines lc 6 lw 5 dt 3 title at 0.150, 0.866

# plot hor axis calendar
replot $data using 0:(0):xticlabel(2) with lines
|
File history
Click on a date/time to view the file as it appeared at that time.
| Date/Time | Thumbnail | Dimensions | User | Comment | |
|---|---|---|---|---|---|
| current | 19:40, 24 September 2020 |  | 3,300 × 1,950 (25 KB) | Jochen Burghardt (talk | contribs) | =={{int:filedesc}}== {{Information |description={{en|1=Diagram of WHO COVID-19 daily data (20 Jan - 16 Aug 2020) for ''"Total Confirmed Cases"'' (thick solid line), its smoothed increment (thick dash-dotted line), ''"Total Deaths"'' (thin dashed line), and its smoothed increment (thin dotted line); see File:WHO_Covid_2020_Jan-Aug_daily_C_Afghanistan.pdf for details.}} |date=2020-09-24 |source={{own}} |author=Jochen Burghardt |permission= |other_versions=[[:File:... |
You cannot overwrite this file.
File usage on Commons
There are no pages that use this file.