File:Zugänge von Asylsuchenden seit 1953.svg

Size of this PNG preview of this SVG file: 800 × 400 pixels. Other resolutions: 320 × 160 pixels | 640 × 320 pixels | 1,024 × 512 pixels | 1,280 × 640 pixels | 2,560 × 1,280 pixels.
Original file (SVG file, nominally 800 × 400 pixels, file size: 70 KB)
Captions
Captions
Add a one-line explanation of what this file represents
Summary
edit
| Description |
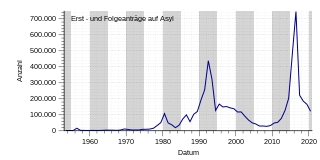
Deutsch: Zugänge von Asylsuchenden seit 1953 |
|||
| Date |
I, the copyright holder of this work, hereby publish it under the following license:
|
|||
| Source | Own work | |||
| Author | Summer, Hi, future humans! (talk · contribs) | |||
| SVG development | ||||
| Source code | Gnuplot code#!/usr/bin/gnuplot
# gnuplot
#########################################################################
# #
# Hier die Daten Ergänzen ! #
# #
#########################################################################
#
# Daten per Here-Document
# (zur tech. Beschreibung siehe Abschntt 'Inline data and datablocks'
# in http://www.gnuplot.info/docs_5.2/Gnuplot_5.2.pdf )
#
#
$my_HereDoc << EndOfData
#
#
# Quelle: die Daten, die Mit Vorlage:Graph im Artikel
# [[:de:Flüchtlingskrise ab 2015 in Deutschland]].
# Da der Name des Artikel z.Zt. häufig geändert wird
# hier der Difflink:
# https://de.wikipedia.org/w/index.php?title=Fl%C3%BCchtlingskrise_ab_2015_in_Deutschland&diff=178587931&oldid=178586636
#
#
30.06.1953 ; 1906
30.06.1954 ; 2174
30.06.1955 ; 1926
30.06.1956 ; 16284
30.06.1957 ; 3112
30.06.1958 ; 2785
30.06.1959 ; 2267
30.06.1960 ; 2980
30.06.1961 ; 2722
30.06.1962 ; 2550
30.06.1963 ; 3238
30.06.1964 ; 4542
30.06.1965 ; 4337
30.06.1966 ; 4370
30.06.1967 ; 2992
30.06.1968 ; 5608
30.06.1969 ; 11664
30.06.1970 ; 8645
30.06.1971 ; 5388
30.06.1972 ; 5289
30.06.1973 ; 5595
30.06.1974 ; 9424
30.06.1975 ; 9627
30.06.1976 ; 11123
30.06.1977 ; 16410
30.06.1978 ; 33136
30.06.1979 ; 51493
30.06.1980 ; 107818
30.06.1981 ; 49391
30.06.1982 ; 37423
30.06.1983 ; 19737
30.06.1984 ; 35278
30.06.1985 ; 73832
30.06.1986 ; 99650
30.06.1987 ; 57379
30.06.1988 ; 103076
30.06.1989 ; 121315
30.06.1990 ; 193063
30.06.1991 ; 256112
30.06.1992 ; 438191
30.06.1993 ; 322599
30.06.1994 ; 127210
30.06.1995 ; 166951
30.06.1996 ; 149193
30.06.1997 ; 151700
30.06.1998 ; 143429
30.06.1999 ; 138319
30.06.2000 ; 117648
30.06.2001 ; 118306
30.06.2002 ; 91471
30.06.2003 ; 67848
30.06.2004 ; 50152
30.06.2005 ; 42908
30.06.2006 ; 30100
30.06.2007 ; 30303
30.06.2008 ; 28018
30.06.2009 ; 33033
30.06.2010 ; 48589
30.06.2011 ; 53347
30.06.2012 ; 77651
30.06.2013 ; 127023
30.06.2014 ; 202834
30.06.2015 ; 476649
30.06.2016 ; 745545
30.06.2017 ; 222683
30.06.2018 ; 185853
30.06.2019 ; 165938
30.06.2020 ; 122170
#
#
#
EndOfData
# Variablen
#
my_xrange_min = '01.01.1953' # Beginn des dargestellten Intervalls
my_xrange_max = '31.12.2020' # Ende des dargestellten Intervalls
my_xtics_years = '10' # Skalenstrich pro Jahr
my_mxtics = '5' # Monatsmarkierung
# Allgemeines zu den Eingabedaten
set timefmt "%d.%m.%Y" # Zeitangaben in TT.MM.YYYY
set datafile separator ";" # Spaltenseparator
# Allgemeines zur Ausgabe
unset key # keine Legende (direkt vorher gesetzt Werte unwirksam)
set style data lines # wird bei 'plot' überschrieben
set style fill transparent solid 0.4 # wird ebenfalls bei 'plot' überschrieben
set border 3 # Rahmen unten (Bit 1) und links (+ Bit 2)
set grid # Gitterlinien verwenden
# Gitterlinienen per Hand setzen falls gewünscht
set style line 1 linetype rgb '#696969' linewidth 0.5 dashtype 0 # Def. Major-grid
set style line 2 linetype rgb '#C9C9C9' linewidth 0.5 dashtype 3 # def. Minor-grid
set grid xtics mxtics # eventuell noxtics und nomxtics
set grid ytics mytics # eventuell noytics und nomytics
set grid back # Gitter im Hintergrund
set grid linestyle 1, linestyle 2 # Setzen des linestyle für Major u. Minor
#show grid # Kontrollausgabe auf der Konsole
# Bereiche/Format/etc X-Achse
set xdata time # X-Achse als Zeitachse
set xlabel 'Jahr' # Beschriftung X-Achse
set xlabel offset 0, 0.75 # Schrift etwas höher
set xrange [ my_xrange_min : my_xrange_max]
# Wertebreich der X-Achse
set xtics '01.01.1000', 60 * 60 * 24 * 365.25 * my_xtics_years
# xtics in Sekunden
# der Beginn (Wert vor dem Komma) der X-Einteilung
# kann außerhalb xrange liegen
set xtics offset 0, 0.5 # Beschriftung näher an die X-Achse
set mxtics my_mxtics # Skalenstriche
set xtics nomirror # Nur unten Skalieren
set format x '%Y' # Beschriftungsformat JJJJ
set xtics out # Skal. aussen damit sie nicht von Grafik
# überschr. wird
set ytics offset 0.5 # Schrift etwas nach rechts
set ytics nomirror # oben keine Teilstriche
set decimalsign locale "de_DE.utf8" # Stelle Input und Output auf "," um
# set decimalsign ',' würde nur Output umstellen,
set format y "%'.0f" # Ausgabeformat
set ytics out # Skal. aussen da sie sonst von Grafik
# überschr. wird
set mytics 5 #
set ylabel offset 2.0, 0.0 # Beschriftung näher an die Y-Achse
# Hintergrund für Jahres-/Quatalsmarkierung
# Sich überlagernde transparente Rechtecke ...
set style rect fillcolor lt -1 fillstyle solid 0.06 noborder
# ... mit for-Schleifen bis ins Jahr 2020 setzen
set for [i=1950:2020:10] \
object rectangle from '01.01.'.i, graph 0 to '31.12.'.(i+4) , graph 1 back
# Außenränder (keine Angabe entspricht Automatik)
set bmargin
set lmargin
set rmargin 1.5 # rechts entspr. der Wert bei Auto etwa 2.8
set tmargin
# Ausgabeformat: Wir erzeugen SVG
# Die Ausgabedaten leiten wir bei UNIX in eine Pipe und sind so beim Namen der
# Ausgabedatei flexibel (Aufruf: Progname.plt > Ausgabe-svg)
# Windowsbenutzer, die mit Pipes nicht umgehen könnten, sollten hier hier das
# folgende 'set output ...' auskommentieren und den Dateinamen ggf. ersetzen.
# set output 'Flüchtlingskrise_ab_2015_in_Deutschland.svg'
set term svg size 800,400 font "Arial,18"
# Die Parameter von 'set term' sind so gewählt, das man in Wikipedia bei einer
# Einbindung [[Datei:Flüchtlingskrise_ab_2015_in_Deutschland.svg|mini|400px|Text]] noch Schrift/Details
# erkennen kann.
# Abkürzungen hinter dem Plot-Befehl:
# u : using
# w : with
# lc : linecolor
# lt : linetype
# lw : linewidth
# pt : pointtype
# ps : pointsize
# lp : linespoints
# p : points
# t : title
# not : notitle
set xtics format '%Y'
set xlabel offset 0.0, 1.0
set xlabel 'Datum'
set yrange [0: 750000]
set ytics 100000
set ylabel 'Anzahl'
unset label # Definiionen von oben löschen
set label 'Erst - und Folgeanträge auf Asyl' at '01.01.1955', 700000 left
plot $my_HereDoc u 1:2 w lp lc rgb 'dark-blue' lt 1 lw 2.5 pt 7 ps 0.3 not
unset multiplot
quit
|
Licensing
edit
I, the copyright holder of this work, hereby publish it under the following license:
| This file is made available under the Creative Commons CC0 1.0 Universal Public Domain Dedication. | |
| The person who associated a work with this deed has dedicated the work to the public domain by waiving all of their rights to the work worldwide under copyright law, including all related and neighboring rights, to the extent allowed by law. You can copy, modify, distribute and perform the work, even for commercial purposes, all without asking permission.
|
File history
Click on a date/time to view the file as it appeared at that time.
| Date/Time | Thumbnail | Dimensions | User | Comment | |
|---|---|---|---|---|---|
| current | 03:44, 2 December 2021 | | 800 × 400 (70 KB) | Hi, future humans! (talk | contribs) | bis 2020 |
| 21:10, 28 June 2018 |  | 800 × 400 (64 KB) | Summer ... hier! (talk | contribs) | Neue Grafik nach Aktualisierung der Quelle. Siehe https://de.wikipedia.org/w/index.php?title=Fl%C3%BCchtlingskrise_ab_2015_in_Deutschland&diff=178709488&oldid=178709275 | |
| 16:26, 28 June 2018 |  | 800 × 400 (64 KB) | Summer ... hier! (talk | contribs) | Text/Lable geändert | |
| 10:49, 25 June 2018 |  | 800 × 400 (64 KB) | Summer ... hier! (talk | contribs) | == {{int:filedesc}} == {{Information |Description = {{de|Zugänge von Asylsuchenden seit 1953}} |Source = {{own}} |Author = Summer |Date = {{self|Cc-zero}} }} == {{int:filedesc}} == == Gnuplot script to generate this plot == {{gnuplot}}{{ValidSVG}}<!--{{Created with Gnuplot | v }}--> <source lang="gnuplot"> #!/usr/bin/gnuplot # gnuplot ######################################################################### # ... |
You cannot overwrite this file.
File usage on Commons
There are no pages that use this file.
File usage on other wikis
The following other wikis use this file: