Mathematical diagram
Mathematic diagrams are diagrams in the field of mathematics, and diagrams using mathematics such as charts and graphs, that are mainly designed to convey mathematical relationships, for example, comparisons over time.

History edit
Geometric diagrams edit
-
 Euclid's Elements, ms. from Lüneburg, 1200 AD
 -
 Manuale Mathematicum, 1619
 -
 Table of Geometry, Cyclopaedia, 1728


Charts and graphs edit
-
 Planetary Movements Chart, 10 th century
 -
 A page from Tractatus de latitudinibus formarum (1505)
 -
 Barchart by William Palyfair, 1781
 -
 Barchart by William Palyfair, 1821


Charts edit
A chart is a type of diagram, that represents tabular numeric data and/or functions. See Category:Charts by type
-
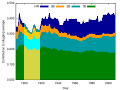 Area chart
 -

-
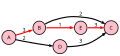
 Bubble chart
 -
 Candlestick chart
 -
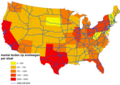 Cartogram
 -
 Control chart
 -

-
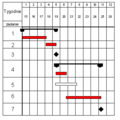 Gantt chart
 -
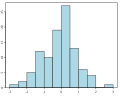 Histogram
 -

-
 Nolan chart
 -
 Nomogram
 -
 PERT chart
 -
 Pareto chart
 -
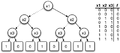
 Pedigree chart
 -
 Pie chart
 -
 Radar chart
 -
 Run chart
 -
 Timeline
 -
 Tree chart
 -
 Vowel chart


.svg)


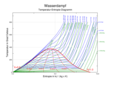
Plots edit
A plot is is a graphical technique for presenting a data set drawn by hand or produced by a mechanical or electronic plotter. It is a graph depicting the relationship between two or more variables used, for instance, in visualising scientific data.


Geometry diagrams edit
- See also Category:Geometry diagrams
Coxeter-Dynkin diagrams edit
A Coxeter-Dynkin diagrams in geometry is a graph with labelled edges. It represents the spatial relations between a collection of mirrors (or reflecting hyperplanes), and describes a kaleidoscopic construction. See Category:Coxeter-Dynkin diagrams


Minkowski diagrams edit
The Minkowski diagram was developed in 1908 by Herman Minkowski and provides an illustration of the properties of space and time in the special theory of relativity. See Category:Minkowski diagrams


Root systems edit
A Root system in mathematics is a configuration of vectors in a Euclidean space satisfying certain geometrical properties. See Category:Root systems


Stellation diagrams edit
A Stellation diagrams, or facetting diagram, (for polyhedra) represents facet plane intersections outside of a uniform polyhedra face. See Category:Stellation diagrams


Logic diagrams edit
Logic diagrams are diagrams in the field of logic, used for representation and to carry out certain types of reasoning
Networks edit
-
 Binary decision diagrams
 -
 Concept maps
 -
 Kripke models
 -
 Logic gates


Sets edit
-
 Edward's Venn diagrams
 -
 Euler diagrams
 -
 Existential graph
 -
 Johnston diagrams
 -
 Spider diagram
 -
 Venn diagram


Tables edit
-
 Carroll diagrams
 -
 Karnaugh maps
 -
 Operation tables in logic
 -
 Truth tables


Trees edit
-
 Argument maps
 -
 Porphyrian tree
 -
 Semantic tableau

.png)

Vector diagrams edit
- See also Category:Vector diagrams
- Category:Phasor diagrams for AC
- Category:Tangent vectors
- Category:Vector fields
- Category:Vector force diagrams
Specific types of diagrams edit
Argand diagram edit
Argand diagrams are frequently used to plot the positions of the poles and zeroes of a function in the complex plane. See Category:Complex plane


Commutative diagrams edit
Commutative diagrams are mathematical diagrams of objects, also known as vertices, and morphisms, also known as arrows or edges. See Category:Commutative diagrams


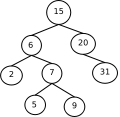
Hasse diagrams edit
A Hasse diagram is a mathematical diagram in the order theory, which is a simple picture of a finite partially ordered set, forming a drawing of the transitive reduction of the partial order. See Category:Hasse diagrams


Petri nets edit
Petri nets shows the structure of a distributed system as a directed bipartite graph with annotations. See Category:Petri nets


Voronoi diagram edit
A Voronoi diagram is a special kind of decomposition of a metric space determined by distances to a specified discrete set of objects in the space, e.g., by a discrete set of points. SeeCategory:Voronoi diagrams


Wallpaper group diagrams edit
A wallpaper group or plane symmetry group or plane crystallographic group is a mathematical classification of a two-dimensional repetitive pattern, based on the symmetries in the pattern. Such patterns occur frequently in architecture and decorative art. There are 17 possible distinct groups. See Category:Wallpaper group diagrams


Other mathematical diagrams edit
- Butterfly diagram: Data-flow diagram connecting the inputs x (left) to the outputs y that depend on them (right) for a "butterfly" step of a radix-2 Cooley-Tukey FFT.
- Cremona diagram: a graphical method used in statics of trusses to determine the forces in members (graphic statics).
- De Finetti diagram: a ternary plot used in population genetics, used to graph the genotype frequencies of populations, where there are two alleles and the population is diploid.
- Knot diagram: In knot theory a useful way to visualise and manipulate knots is to project the knot onto a plane—think of the knot casting a shadow on the wall.
- Ulam spiral: a simple method of graphing the prime numbers that reveals a pattern.
- Van Kampen diagram: a planar diagram used to represent the fact that a particular word among the generators of a group given by a group presentation represents the identity element in that group.
- A Young diagrams or Young tableau: a combinatorial object useful in representation theory. It provides a convenient way to describe the group representations of the symmetric and general linear groups and to study their properties.
-
 Butterfly diagram
 -
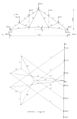 Cremona diagram
 -
 De Finetti diagram
 -
 Knot diagram
 -
 Van Kampen diagram
 -
 Ulam spiral
 -
 Young diagram
 -
 Fields of Mathematics
 -
 palindrome
 -
 Palindrome
 -
 mathematicians
 -
 mathematicians


