Category:Election maps of the United States
Countries of the Americas: Antigua and Barbuda · Argentina · The Bahamas · Barbados · Belize · Bolivia · Brazil · Canada · Chile · Colombia · Costa Rica · Cuba · Dominica · Dominican Republic · Ecuador · El Salvador · Grenada · Guatemala · Guyana · Haiti · Honduras · Jamaica · Mexico · Nicaragua · Panama · Paraguay · Peru · Saint Kitts and Nevis · Saint Lucia · Saint Vincent and the Grenadines · Suriname · Trinidad and Tobago · United States of America · Uruguay · Venezuela
Other areas: Anguilla · Bermuda · British Virgin Islands · Cayman Islands · Falkland Islands · French Guiana · Greenland · Guadeloupe · Martinique · Montserrat · Puerto Rico · Saint Barthélemy · Saint-Martin · Saint Pierre and Miquelon · Turks and Caicos Islands · United States Virgin Islands
Other areas: Anguilla · Bermuda · British Virgin Islands · Cayman Islands · Falkland Islands · French Guiana · Greenland · Guadeloupe · Martinique · Montserrat · Puerto Rico · Saint Barthélemy · Saint-Martin · Saint Pierre and Miquelon · Turks and Caicos Islands · United States Virgin Islands
Subcategories
This category has the following 23 subcategories, out of 23 total.
*
E
G
H
L
P
S
U
W
📚
Pages in category "Election maps of the United States"
This category contains only the following page.
Media in category "Election maps of the United States"
The following 200 files are in this category, out of 374 total.
(previous page) (next page)-
 117th Congress Party Makeup.svg 1,242 × 721; 4.05 MB
-
 117th US Congress Map corrected.png 5,285 × 3,762; 922 KB
-
 117th US Congress Map.png 5,285 × 3,762; 1.24 MB
-
 1804senatemap.svg 577 × 593; 98 KB
-
 1860 United States Presidential Election Counties.svg 840 × 550; 13.54 MB
-

-
 1876RepublicanVicePresidentialNomination1stBallotPartial.png 1,513 × 983; 76 KB
-
 1894 US House of Representatives election results.svg 800 × 504; 33.38 MB
-
 1900houseelections.svg 800 × 345; 17.38 MB
-
 1936 United States House elections.svg 800 × 504; 1.54 MB
-

-
-
 1956 OR-1 Election.png 1,167 × 1,232; 56 KB
-
 1956 OR-4 Election.png 1,269 × 1,676; 68 KB
-
-
 1960 United States House elections.svg 800 × 504; 35.6 MB
-
 1960 US Presidential election by congressional district.svg 800 × 504; 37.15 MB
-

-
 1968 House elections by Voteshare.svg 854 × 502; 2.31 MB
-

-
 1968 senate election in IL.svg 810 × 810; 43 KB
-
 1968 senate election in SC.svg 810 × 648; 53 KB
-
 1968 senate election in SD.svg 744 × 474; 203 KB
-
 1968 senate election in UT.svg 810 × 810; 29 KB
-
 1968 senate election in WA.svg 810 × 535; 61 KB
-
 1972 MO GOV.svg 810 × 717; 49 KB
-

-
 1977DemPrimNE.png 702 × 717; 42 KB
-

-
 1984 Iowa Democratic presidential caucuses by county.svg 810 × 532; 30 KB
-

-
 1984GOPPresidentialPrimaryMap.svg 990 × 627; 315 KB
-
 1988RepublicanPresidentialPrimaries.png 640 × 469; 65 KB
-
 1994 TX-02 election.svg 800 × 785; 1.52 MB
-

-
 1996 Republican presidential primaries.JPG 452 × 360; 25 KB
-
 1996 republicano.png 1,920 × 1,187; 236 KB
-
 2000 US Presidential Election by Popular Vote.svg 512 × 325; 46 KB
-
 2004 New Hampshire Democratic presidential primary results by county.svg 809 × 1,560; 401 KB
-
 2004 us discrepancy 12 22.jpg 576 × 345; 123 KB
-
 2004 US Presidential Election by Popular Vote.svg 512 × 325; 46 KB
-
 2008 US Presidential Election by Popular Vote.svg 512 × 325; 46 KB
-
 2009 Senate election map.svg 959 × 593; 61 KB
-
 2012 Democratic presidential primary results by county.svg 1,304 × 828; 1.52 MB
-
 2012 US Presidential Election by Popular Vote.svg 512 × 325; 46 KB
-
 2014 Arkansas House District 3 by county.svg 800 × 648; 84 KB
-
 2014 Arkansas House District 4 by county.svg 799 × 750; 441 KB
-
 2016 Arkansas House District 2.svg 800 × 685; 122 KB
-
 2016 Arkansas House District 3 by county.svg 800 × 648; 84 KB
-
 2016 Arkansas House District 4 by county.svg 799 × 750; 441 KB
-
 2016 US Presidential Election by Popular Vote.svg 512 × 325; 50 KB
-
 2020 MI-03 Election by County.svg 850 × 950; 31 KB
-
 2020 MI-04 Election by County.svg 850 × 700; 75 KB
-
 2020 MI-05 Election by County.svg 850 × 1,700; 104 KB
-
 2020 MI-06 Election by County.svg 850 × 550; 52 KB
-
 2020 MI-07 Election by County.svg 850 × 450; 61 KB
-
 2020 MI-08 Election by County.svg 850 × 300; 19 KB
-
 2020 MI-09 Election by County.svg 850 × 350; 19 KB
-
 2020 MI-10 Election by County.svg 850 × 1,000; 212 KB
-
 2020 MI-11 Election by County.svg 850 × 650; 18 KB
-
 2020 MI-12 Election by County.svg 850 × 400; 18 KB
-
 2020 MI-13 Election by County.svg 850 × 500; 13 KB
-
 2020 MI-14 Election by County.svg 850 × 600; 20 KB
-

-

-
 2020 US Presidential Election by Popular Vote.svg 512 × 325; 50 KB
-
 2022 FL AG SH.svg 912 × 779; 460 KB
-
 2022 FL CA SH.svg 912 × 779; 461 KB
-
-
 2022 Ohio Attorney General election by Congressional District.svg 810 × 810; 334 KB
-
 2022 Ohio Attorney General election by State House District.svg 744 × 744; 608 KB
-
 2022 Ohio Attorney General election by State Senate District.svg 744 × 744; 372 KB
-
 2022 Ohio Senate SS.svg 744 × 744; 371 KB
-

-

-
 2022 Ohio United States Senate election by State House District.svg 744 × 744; 608 KB
-
 2022 SS results margin.svg 744 × 744; 371 KB
-
 2022 SS results.svg 744 × 744; 371 KB
-
 2022 Texas State House election 2.svg 1,066 × 780; 774 KB
-
 2022 TX AG SH.svg 1,066 × 780; 774 KB
-
 2022 U.S. Gubernatorial Elections.png 1,920 × 1,187; 255 KB
-
 2022 United States House of Representatives elections.svg 996 × 501; 1.68 MB
-
 2022 United States treasurer results.svg 959 × 593; 79 KB
-
 2023 United States attorney general elections results map.svg 959 × 593; 75 KB
-
 2023 VA-4 County Map.svg 825 × 850; 509 KB
-
 2024stateupperhouses.svg 959 × 593; 36 KB
-
 2nd Trump impeachment house vote.svg 512 × 243; 1.94 MB
-
 79th US senate.svg 512 × 317; 171 KB
-
 Arkansas County Flips 2004.svg 810 × 709; 44 KB
-
 Arkansas County Swing 2016.svg 744 × 655; 386 KB
-
 Arkansas County Trend 2016.svg 744 × 655; 386 KB
-
 Ballot access for Gloria La Riva as of May 26, 2020.png 800 × 495; 74 KB
-
 Ballot access of Gary Johnson in the 2012 US presidential election.png 1,513 × 983; 24 KB
-
 Ballot-access of Thomas Stevens in the 2012 US Presidential Election.PNG 1,513 × 983; 87 KB
-
 Boston Tea Party Ballot Access Locator Map, 2008 (United States of America).png 6,000 × 3,710; 946 KB
-
 Brian Caroll ballot access, July 1, 2020.png 1,513 × 983; 44 KB
-
 Cartogram of 2008-2020 US presidential elections.svg 512 × 384; 82 KB
-
 Class 1 US Senators by State & Party.svg 959 × 593; 33 KB
-
 Class 2 US Senators by State & Party.svg 959 × 593; 33 KB
-
 Class 3 US Senators by State & Party.svg 959 × 593; 33 KB
-
 Colorado County Flips 2004.svg 744 × 548; 313 KB
-
 Colorado County Swing 2016.svg 744 × 548; 316 KB
-
 Connecticut County Flips 2004.svg 810 × 595; 22 KB
-
 Connecticut County Swing 2016.svg 744 × 556; 47 KB
-
 Connecticut County Trend 2016.svg 744 × 556; 47 KB
-
 CSAElectoralCollege1861.svg 1,260 × 990; 8.07 MB
-
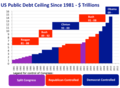 Debt Ceiling 1981-2010.png 844 × 617; 70 KB
-
 Delaware County Swing 2016.svg 744 × 744; 21 KB
-
 Delaware County Trend 2016.svg 744 × 744; 21 KB
-
 Delegation Vote, 2016 (Republican Party).png 959 × 593; 221 KB
-
 Dem 2016 primary map FEB.jpg 1,024 × 686; 123 KB
-
 Early voting US States 2020.svg 512 × 317; 39 KB
-
 Early voting US states.svg 959 × 593; 113 KB
-
 Election Américaines 2016.png 6,900 × 4,275; 3.52 MB
-
 Election audits of President and other contests.png 4,280 × 6,752; 1.63 MB
-
 ElectionPollsUSA2020.svg 1,020 × 593; 335 KB
-
 ElectoralCollege1861.svg 650 × 400; 27 KB
-
 ElectoralCollege1976 (2).png 1,020 × 593; 136 KB
-
 ElectoralCollege2020 with results Black and White.png 1,200 × 698; 118 KB
-
 Electoralmap2020-pundits.svg 1,020 × 593; 35 KB
-
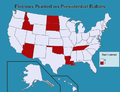 ElectorsPrintedOnPresidentialBallots.png 797 × 609; 115 KB
-
 Felony disenfranchisement in the United States.svg 959 × 593; 43 KB
-
 First ballot of the 1948 Republican National Convention.svg 990 × 627; 329 KB
-
 First round austin.png 714 × 715; 248 KB
-
 Florida County Swing 2016.svg 744 × 727; 425 KB
-
 Florida County Trend 2016.svg 744 × 727; 425 KB
-
 GA CD2 By County 2010.svg 800 × 1,111; 209 KB
-
 GA2006CD2BYCOUNTY.svg 800 × 1,111; 209 KB
-
 GA2014CD2BYCOUNTY.svg 800 × 1,259; 187 KB
-
 GA2016CD2BYCOUNTY.svg 800 × 1,259; 187 KB
-
 GA2018CD2BYCOUNTY.svg 800 × 1,259; 183 KB
-
 GA2020CD2BYCOUNTY.svg 800 × 1,259; 188 KB
-
 GACD2COUNTY.svg 800 × 1,111; 209 KB
-
 Georga 2nd district 2012 by county.svg 800 × 1,259; 183 KB
-
 Gott electoral cartogram color.PNG 552 × 348; 13 KB
-
 Hawaii County Swing 2016.svg 275 × 161; 6 KB
-
 Hawaii County Trend 2016.svg 275 × 161; 6 KB
-
 Idaho County Swing 2016.svg 744 × 744; 309 KB
-
 Illinois County Swing 2016.svg 810 × 810; 39 KB
-
 Indiana County Flips 2004.svg 810 × 810; 33 KB
-
 Indiana County Swing 2016.svg 810 × 810; 37 KB
-
 Indiana County Trend 2016.svg 810 × 810; 37 KB
-
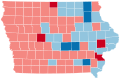 Iowa County Flips 2004.svg 810 × 532; 29 KB
-
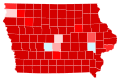 Iowa County Swing 2016.svg 744 × 498; 181 KB
-
 Iowa County Trend 2016.svg 744 × 498; 181 KB
-
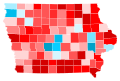
 Iowa Rep Caucus 2024.svg 810 × 532; 138 KB
-
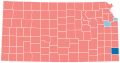 Kansas County Flips 2008.svg 810 × 424; 33 KB
-
 Kansas County Swing 2016.svg 744 × 400; 180 KB
-
 Kentucky County Swing 2016.svg 744 × 341; 802 KB
-
 Kentucky County Trend 2016.svg 744 × 341; 802 KB
-
 Libertarian Party Ballot Access Locator Map, 1972 (United States of America).png 6,000 × 3,710; 952 KB
-
 Libertarian Party Ballot Access Locator Map, 1976 (United States of America).png 6,000 × 3,710; 1.01 MB
-
 Libertarian Party Ballot Access Locator Map, 1984 (United States of America).png 6,000 × 3,710; 987 KB
-
 Libertarian Party Ballot Access Locator Map, 1988 (United States of America).png 6,000 × 3,710; 983 KB
-
 Libertarian Party Ballot Access Locator Map, 1996 (United States of America).png 6,000 × 3,710; 1,009 KB
-
 Libertarian Party Ballot Access Locator Map, 2004 (United States of America).png 6,000 × 3,710; 987 KB
-
 Libertarian Party Ballot Access Locator Map, 2008 (United States of America).png 6,000 × 3,710; 982 KB
-
 Libertarian Party Ballot Access Locator Map, 2012 (United States of America).png 6,000 × 3,710; 982 KB
-
 Libertarian Party presidential election results (United States of America).png 1,500 × 8,000; 1.45 MB
-
 Libertarian Party presidential election results, 1972 (United States of America).png 4,000 × 2,473; 82 KB
-

-

-
 Libertarian Party presidential election results, 1976 (United States of America).png 4,000 × 2,473; 311 KB
-

-

-

-
 Libertarian Party presidential election results, 1984 (United States of America).png 4,000 × 2,473; 305 KB
-

-

-
 Libertarian Party presidential election results, 1988 (United States of America).png 4,000 × 2,473; 325 KB
-

-

-
 Libertarian Party presidential election results, 1992 (United States of America).png 4,000 × 2,473; 324 KB
-

-

-
 Libertarian Party presidential election results, 1996 (United States of America).png 4,000 × 2,473; 329 KB
-

-

-
 Libertarian Party presidential election results, 2000 (United States of America).png 4,000 × 2,473; 326 KB
-

-

-
 Libertarian Party presidential election results, 2004 (United States of America).png 4,000 × 2,473; 326 KB
-

-

-
 Libertarian Party presidential election results, 2008 (United States of America).png 4,000 × 2,473; 323 KB
-

-

-
 Libertarian Party presidential election results, 2012 (United States of America).png 4,000 × 2,473; 325 KB
-

-

-
 Maine County Swing 2016.svg 744 × 744; 229 KB
-
 Maine County Trend 2016.svg 744 × 744; 229 KB
-

-

-

-
 MAP Senate 2020 Election.png 5,175 × 3,762; 1.27 MB
-
 MAP Senate 2020 Elections.png 5,175 × 3,762; 932 KB
-
 Maryland County Flips 2004.svg 810 × 433; 40 KB
-
 Maryland County Flips 2008.svg 744 × 405; 222 KB
-
 Maryland County Swing 2016.svg 744 × 405; 225 KB


.png)


.png)


.png)


.png)
.png)
.png)
.png)
.png)
.png)
.png)
.png)
.png)
.png)
.png)
.png)
.png)
.png)
.png)
.png)
.png)
.png)
.png)
.png)
.png)
.png)
.png)
.png)
.png)
.png)
.png)
.png)
.png)
.png)
.png)
.png)
.png)
.png)
.png)
.png)
.png)
.png)
.png)


.png)


.png)