Category:Hydrographic maps
line between points of same depth  | |||||
| Upload media | |||||
| Subclass of |
| ||||
|---|---|---|---|---|---|
| |||||
Subcategories
This category has the following 19 subcategories, out of 19 total.
!
*
+
D
E
F
M
- Maps of drainage (15 F)
- Maps of estuaries (2 F)
N
P
S
- Soil hydration maps (1 F)
V
- Vegetation anomaly maps (5 F)
W
Media in category "Hydrographic maps"
The following 49 files are in this category, out of 49 total.
-
 1753 plano ciudad de México.jpg 1,000 × 1,242; 482 KB
-
-
 Acheson KB 1.jpg 944 × 720; 91 KB
-
 Archiv für die naturwissenschaftliche Landesdurchforschung von Böhmen (1887) (19705245604).jpg 1,718 × 2,808; 1,011 KB
-

-

-
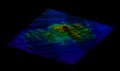
 Bathy 12 07 T 1208 1024.png 1,280 × 1,024; 40 KB
-

-
 Dalgleish map colour 050223.png 3,586 × 2,436; 4.15 MB
-
 Dive sites of Whittle Rock on multibeam map.jpg 1,683 × 1,289; 520 KB
-
 Elemets of water course-sr.svg 489 × 583; 12 KB
-
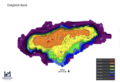
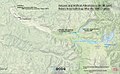
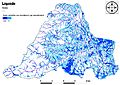
 GBystrzyckie-hydrologia.png 1,361 × 1,645; 142 KB
-

-
 Global OFG.png 714 × 547; 288 KB
-
 Grontmy(1966) ArubaSoilPotentiallityMap scanOfPaperMap.jpg 19,757 × 9,440; 5.55 MB
-
 Guiné-Porto de Bissau - 1915.png 480 × 511; 366 KB
-
 Havixsandstein24041161.jpg 2,408 × 2,048; 1.35 MB
-
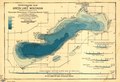 Hydrographic Map of Green Lake Wisconsin.pdf 4,204 × 2,883; 2.43 MB
-
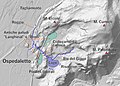 Idrografia Lago di Ospedaletto.jpg 2,022 × 1,441; 892 KB
-
 International Hydrographic Organization countries.PNG 1,350 × 625; 37 KB
-
 Jalalpur Irrigation Project.jpg 1,486 × 1,146; 287 KB
-
 Loireinondableruissellement.jpg 2,480 × 3,507; 5.21 MB
-
 Map Surface water 1990 - Touring Club Italiano CART-TEM-017.jpg 2,500 × 1,710; 3.35 MB
-
 Mercierinondableparruissellement.jpg 3,464 × 2,158; 5.21 MB
-
 Mercierproductionruissellement.jpg 3,456 × 2,371; 3.31 MB
-
 Merciertransfertruissellement.jpg 3,471 × 2,390; 2.28 MB
-
 Mt. Saint Helens post-eruption hydrology alterations.jpg 1,453 × 892; 547 KB
-
 Nafarroako ibaiak.svg 719 × 748; 4.88 MB
-
 Palma-z-19.jpg 937 × 598; 77 KB
-
 PTA mercier.jpg 3,781 × 850; 1.82 MB
-
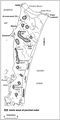
 PunataRegion.JPG 492 × 576; 44 KB
-
 Sources GIS Coast-fr.svg 4,052 × 2,670; 208 KB
-
 Tide legal use.gif 720 × 477; 31 KB
-
 Tiefen-Tracks Palma.jpg 1,334 × 889; 215 KB
-
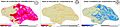
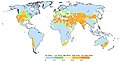
 Total Renewable Freshwater Resources in mm per year By WaterGAP Average 1961-1990.jpg 3,200 × 1,580; 564 KB
-
 Total Renewable GroundwaterResources by WaterGAP in mm per year.png 2,300 × 1,250; 80 KB
-
 Total Water Withdrawals in mm per year By WaterGAP Average 1998-2002.jpg 3,360 × 1,860; 456 KB
-
 Towlow KB 1.jpg 928 × 720; 112 KB
-
 Tracking Chart Fitzroy 1839 Volume 2 Appendix narrativeofsurve21839fitz 0221.jpg 2,582 × 4,396; 2.32 MB
-
 Undervattenssten sjökort.png 313 × 413; 3 KB
-
 Wassertiefen Gübsensee 2013-10-11 z17 4x3.tif 1,278 × 958; 3.51 MB
-
 Wassertiefen-per-Crowdsourcing chaotisch z18.jpg 1,920 × 1,080; 775 KB
-
 Water Stress Around 2000 A.D. By WaterGAP.jpg 1,540 × 800; 134 KB
-
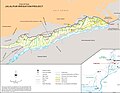
 Water supply of St. Mary and Milk Rivers, 1898-1917 (1920) (14774124504).jpg 4,686 × 2,058; 1.37 MB
-
 WikiDACH-2015-Schweriner See.jpg 1,077 × 725; 588 KB
-
 WorldWaterAvailability lb.svg 1,696 × 785; 157 KB
-
 Yzeronzonesinondableparruissellement.jpeg 3,507 × 2,480; 4.7 MB
-
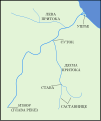
 Гидрология Норт Стрекборд Исланд.PNG 249 × 499; 56 KB
-
 Потоп место прорыва 589 для загрузки.jpg 825 × 511; 281 KB


_(19705245604).jpg)
_(20327907505).jpg)
_(20333933251).jpg)


.jpg)

_ArubaSoilPotentiallityMap_scanOfPaperMap.jpg)


_(14774124504).jpg)


