Category:Invalid SVG created with Gnuplot code

Media in category "Invalid SVG created with Gnuplot code"
The following 26 files are in this category, out of 26 total.
-
 Line graph - displacement of 3 pedestrians - fr.svg 802 × 603; 71 KB
-
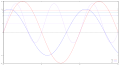 AC power full graph.svg 1,711 × 939; 64 KB
-

-
 Line graph - angle traveled in 2 s - fr.svg 1,498 × 876; 60 KB
-
 Line graph - const 0.5 m s^-1 velocity in 1.4 ks - fr.svg 802 × 603; 58 KB
-
 Line graph - constant 25*pi angular acceleration in 2 s - fr.svg 1,498 × 876; 64 KB
-
 Line graph - constant 50*pi angular acceleration in 2 s - fr.svg 802 × 603; 64 KB
-
 Line graph - linear 25*pi*t angular velocity in 2 s - fr.svg 1,498 × 876; 64 KB
-
 Line graph - nul acceleration in 1.4 ks - fr.svg 802 × 603; 54 KB
-
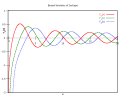 BesselY plot.svg 600 × 480; 75 KB
-
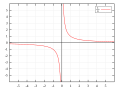 Hyperbola one over x.svg 1,600 × 1,200; 24 KB
-
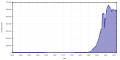
 Einwohnerentwicklung von Niedersachsen.svg 800 × 400; 51 KB
-
 Kartoffelparadoxon.svg 770 × 577; 16 KB
-
 Butylkautschuk-Spinne v2.svg 700 × 700; 33 KB
-
 Catenoid.svg 600 × 480; 75 KB
-
 Chloropren-Kautschuk-Spinne.svg 700 × 700; 33 KB
-
 Dortmund population.svg 800 × 400; 31 KB
-
 Dresden population.svg 800 × 400; 25 KB
-
 Duisburg population.svg 800 × 400; 27 KB
-
 Einwohnerentwicklung in rosenheim.svg 800 × 400; 11 KB
-
 Einwohnerentwicklung Kolbermoor.svg 800 × 400; 13 KB
-
 Electricity Production in the USA.svg 640 × 480; 21 KB
-
 Example dft dct.svg 600 × 480; 16 KB
-
 Fluorkautschuk-Spinne.svg 700 × 700; 32 KB
-
 Leipzig population.svg 800 × 400; 22 KB
-
 Polyvinylalkohol-Spinne.svg 700 × 700; 33 KB


