File:2017 North Indian Ocean cyclone season summary.png

Size of this preview: 800 × 494 pixels. Other resolutions: 320 × 198 pixels | 640 × 396 pixels | 1,024 × 633 pixels | 1,280 × 791 pixels | 2,560 × 1,582 pixels | 4,000 × 2,472 pixels.
Original file (4,000 × 2,472 pixels, file size: 10.07 MB, MIME type: image/png)
Captions
Captions
Add a one-line explanation of what this file represents
Summary edit
| Description |
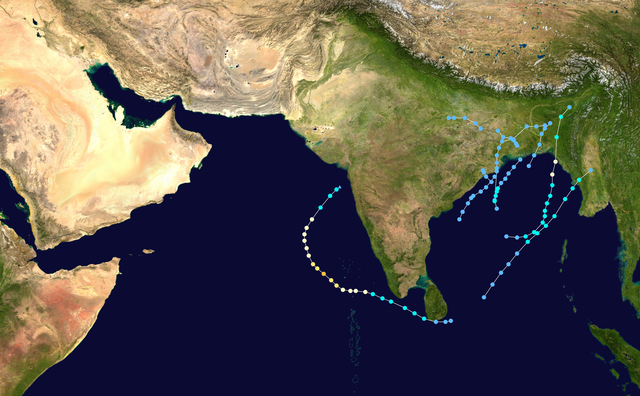
English: This map shows the tracks of all tropical cyclones in the 2017 North Indian Ocean cyclone season. The points show the location of each storm at 6-hour intervals. The colour represents the storm's maximum sustained wind speeds as classified in the Saffir-Simpson Hurricane Scale (see below), and the shape of the data points represent the type of the storm. Map generation parameters: --res 4000 --extra 1 --dots 0.2 --lines 0.04 --xmin 40 --xmax 100 --ymin 0 --ymax 35
Tropical depression (≤38 mph, ≤62 km/h)
Tropical storm (39–73 mph, 63–118 km/h)
Category 1 (74–95 mph, 119–153 km/h)
Category 2 (96–110 mph, 154–177 km/h)
Category 3 (111–129 mph, 178–208 km/h)
Category 4 (130–156 mph, 209–251 km/h)
Category 5 (≥157 mph, ≥252 km/h)
Unknown
Storm type |
| Source | Created using Wikipedia:WikiProject Tropical cyclones/Tracks. The background image is from NASA [1]. The tracking data is from the Joint Typhoon Warning Center's best track database |
| Author | Meow |

|
This file may be updated to reflect new information. If you wish to use a specific version of the file without new updates being mirrored, please upload the required version as a separate file. |
| This work has been released into the public domain by its author, Meow. This applies worldwide. In some countries this may not be legally possible; if so: Meow grants anyone the right to use this work for any purpose, without any conditions, unless such conditions are required by law. |
File history
Click on a date/time to view the file as it appeared at that time.
| Date/Time | Thumbnail | Dimensions | User | Comment | |
|---|---|---|---|---|---|
| current | 07:10, 26 November 2019 | | 4,000 × 2,472 (10.07 MB) | Supportstorm (talk | contribs) | Best track update |
| 18:46, 26 February 2018 |  | 4,000 × 2,472 (9.26 MB) | Keith Edkins (talk | contribs) | Ockhi & BOB 08 | |
| 21:26, 18 November 2017 |  | 4,000 × 2,472 (9.22 MB) | Keith Edkins (talk | contribs) | Up to BOB06 | |
| 21:22, 27 July 2017 |  | 4,000 × 2,472 (9.19 MB) | Keith Edkins (talk | contribs) | Add 3 depressions | |
| 12:07, 31 May 2017 |  | 4,000 × 2,472 (9.86 MB) | Meow (talk | contribs) | Mora | |
| 15:10, 29 May 2017 |  | 4,000 × 2,472 (9.85 MB) | Meow (talk | contribs) | == {{int:filedesc}} == {{Hurricane season auto track map|start=2017-04-13|end=|source=JTWC|type=cyclone|basin=North Indian Ocean|year=2017|comments= Map generation parameters: <tt>--res 4000 --extra 1 --dots 0.2 --lines 0.04 --xmin 40 --xmax 100 -... |
You cannot overwrite this file.
File usage on Commons
The following 5 pages use this file:
- Commons:WikiProject Aviation/recent uploads/2017 July 27
- Commons:WikiProject Aviation/recent uploads/2017 May 29
- Commons:WikiProject Aviation/recent uploads/2017 May 31
- Commons:WikiProject Aviation/recent uploads/2017 November 18/Overflow 1
- Commons:WikiProject Aviation/recent uploads/2018 February 26
File usage on other wikis
The following other wikis use this file:
- Usage on bn.wikipedia.org
- Usage on de.wikipedia.org
- Usage on en.wikipedia.org
- Usage on es.wikipedia.org
- Usage on ko.wikipedia.org
- Usage on pt.wikipedia.org
- Usage on th.wikipedia.org
- Usage on zh.wikipedia.org