File:Gas Balance Germany.svg

Size of this PNG preview of this SVG file: 800 × 436 pixels. Other resolutions: 320 × 175 pixels | 640 × 349 pixels | 1,024 × 559 pixels | 1,280 × 698 pixels | 2,560 × 1,396 pixels | 990 × 540 pixels.
Original file (SVG file, nominally 990 × 540 pixels, file size: 74 KB)
Captions
Captions
Add a one-line explanation of what this file represents
Summary edit
| Description |
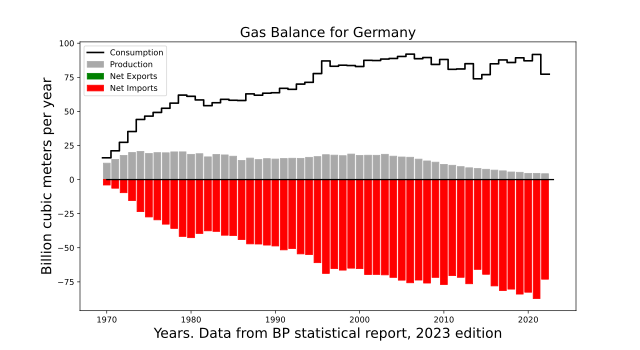
English: Natural gas balance for this country. This is meant to supersede old "ELM" graphs uploaded in 2008 by Jonathan Callahan , that are out-of-date, non-vectorial and of dubious license.
The data are from BP statistical report. note that imports or exports are approximated using the difference between production and consumption. This ignores distirbution losses or stock changes. The graphs are generated automagically from BP's excel file using a PYTHON script. It can be found here for future updates. |
| Date | |
| Source | Own work |
| Author | Raminagrobis |
Licensing edit
I, the copyright holder of this work, hereby publish it under the following license:
This file is licensed under the Creative Commons Attribution-Share Alike 4.0 International license.
- You are free:
- to share – to copy, distribute and transmit the work
- to remix – to adapt the work
- Under the following conditions:
- attribution – You must give appropriate credit, provide a link to the license, and indicate if changes were made. You may do so in any reasonable manner, but not in any way that suggests the licensor endorses you or your use.
- share alike – If you remix, transform, or build upon the material, you must distribute your contributions under the same or compatible license as the original.
File history
Click on a date/time to view the file as it appeared at that time.
| Date/Time | Thumbnail | Dimensions | User | Comment | |
|---|---|---|---|---|---|
| current | 15:28, 26 November 2023 | | 990 × 540 (74 KB) | Raminagrobis (talk | contribs) | {{Information |description={{en|1=Gas balance for Germany. This is meant to supersede old "ELM" graphs uploaded in 2008 by Jonathan Callahan , that are out-of-date, non-vectorial and of dubious license. The data are from BP statistical report (2021 Edition). note that imports or exports are approximated using the difference between production and consumption. This is a good approximation, but not 100% accurate because some countries can import and export petroleum in the same ti... |
| 18:29, 11 September 2021 |  | 990 × 540 (71 KB) | Raminagrobis (talk | contribs) | =={int:filedesc}== {Information |description={en|1=Gas balance for this country. This is meant to supersede old "ELM" graphs uploaded in 2008 by Jonathan Callahan , that are out-of-date, non-vectorial and of dubious license. The data are from BP statistical report. note that imports or exports are approximated using the difference between production and consumption. This is a good approximation, but not 100% accurate because some countries can import and export petroleum in... | |
| 18:47, 25 June 2020 |  | 576 × 432 (73 KB) | Raminagrobis (talk | contribs) | Annual update 2020. Data from BP stat report. Generated using python | |
| 22:08, 4 August 2019 |  | 720 × 540 (74 KB) | Raminagrobis (talk | contribs) | annual update | |
| 10:02, 25 June 2017 |  | 720 × 540 (77 KB) | Raminagrobis (talk | contribs) | annual update 2017 | |
| 07:29, 4 November 2016 |  | 720 × 540 (76 KB) | Raminagrobis (talk | contribs) | User created page with UploadWizard |
You cannot overwrite this file.
File usage on Commons
There are no pages that use this file.
File usage on other wikis
The following other wikis use this file:
- Usage on de.wikipedia.org
- Usage on www.wikidata.org