Lady3mlnm
Almost all my charts have English and Russian versions. To be short, here I give links only to English versions.
Life expectancy in countries edit
- Europe
Austria,
Belgium,
Bulgaria,
Czechia,
Denmark,
Finland,
France,
Germany,
Greece,
Hungary,
Iceland,
Ireland,
Italy,
Liechtenstein,
Lithuania,
Luxembourg,
Malta,
the Netherlands,
Norway,
Poland,
Portugal,
Romania,
Slovakia,
Spain,
Sweden,
Switzerland,
the United Kingdom
post-Yugoslavia countries:
Slovenia,
Croatia,
Bosnia and Herzegovina,
Montenegro,
Serbia,
North Macedonia
European post-USSR countries:
Russia,
Belarus,
Ukraine,
Moldova
- Asia
Afghanistan,
Bangladesh,
Bhutan,
China (Hong Kong, Macao),
Cyprus,
India,
Indonesia,
Iran,
Iraq,
Israel,
Japan,
Jordan,
Kuwait,
Lebanon,
Malaysia,
the Maldives,
Mongolia,
Nepal,
North Korea,
Oman,
Pakistan,
Palestine,
the Philippines,
Qatar,
Saudi Arabia,
Singapore,
South Korea,
Sri Lanka,
Syria,
Thailand,
Turkey,
the United Arab Emirates,
Vietnam
Asian post-USSR countries:
Georgia,
Azerbaijan,
Armenia,
Kazakhstan,
Turkmenistan,
Uzbekistan,
Kyrgyzstan,
Tajikistan
- Oceania
- America
Argentina, Bermuda, Brazil, Canada, Chile, Colombia, Costa Rica, Cuba, the Dominican Republic, Ecuador, Guatemala, Haiti, Mexico, Peru, Uruguay, the USA, Venezuela
- Africa
Algeria, Angola, Botswana, the Democratic Republic of the Congo, Egypt, Ethiopia, Kenya, Libya, Mali, Morocco, Niger, Nigeria, Seychelles, Somalia, South Africa, Tanzania, Tunisia, Uganda, Zimbabwe
- macroregions
world,
Arab world,
European Union,
North America,
South Asia,
sub-Saharan Africa,
countries with high income,
countries with middle income,
countries with low income,
comparison of countries with different income
Comparison of countries edit
-
 Comparison of life expectancy in some big countries
 -
 Comparison of life expectancy in USA, China and Russia
 -
 Comparison of life expectancy in USA and Russia
 -
 Comparison of life expectancy in the largest European countries
 -
 Comparison of life expectancy in some European countries
 -
 Comparison of life expectancy in some European countries (continue)
 -
 Comparison of life expectancy in Asian countries
 -
 Comparison of life expectancy in countries of South-East Asia and Oceania
 -
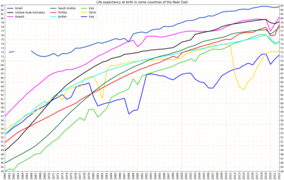 Comparison of life expectancy at birth in some countries of the Near East
 -
 Comparison of life expectancy in countries of North America
 -
 Comparison of life expectancy in countries of South America
 -
 Comparison of life expectancy in African countries
 -
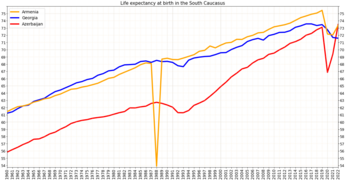 Comparison of life expectancy in the South Caucasus
 -
 Comparison of life expectancy in the South Caucasus and its neighbours
 -
 Comparison of life expectancy at birth in countries of CIS
 -
 Comparison of life expectancy in Ukraine, Belarus, Russia, and Kazakhstan
 -
 Comparison of life expectancy in Ukraine and Russia
 -
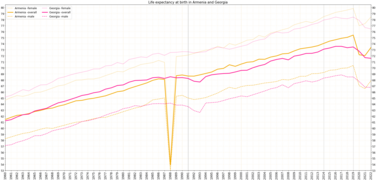 Comparison of life expectancy in Armenia and Georgia
 -
 Comparison of life expectancy in Armenia and Azerbaijan
 -
 Comparison of life expectancy in Georgia and Azerbaijan
 -
 Comparison of life expectancy in Turkey and Azerbaijan
 -
 Comparison of life expectancy in Turkey and Armenia
 -
 Comparison of life expectancy in South and North Koreas


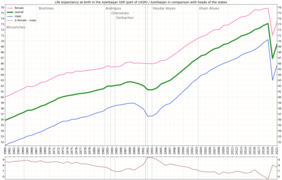
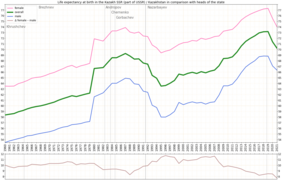
Life expectancy in countries vs their leaders edit
-
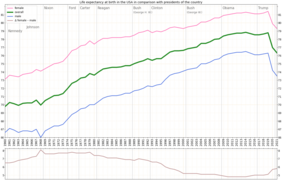 USA
USA -
 China
China -
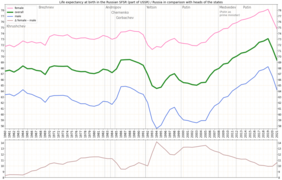 Russia
 -
 United Kingdom
 -
 France
 -
 Spain
Spain -
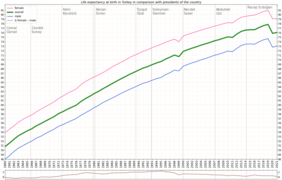 Turkey
 -
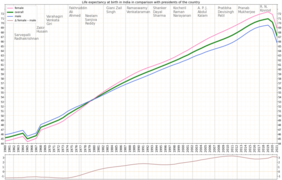 India
India
(presidents) -
 India
India
(prime-ministers) -
 Saudi Arabia
 -
 United Arab Emirates


_-leader.png)


-
 Belarus
 -
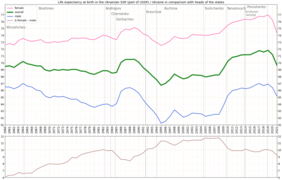 Ukraine
 -
 Georgia
 -
 Azerbaijan
 -
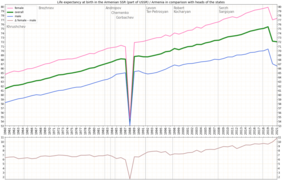 Armenia
 -
 Kazakhstan
 -
 Uzbekistan


Bubble charts of male and female life expectancy edit
-
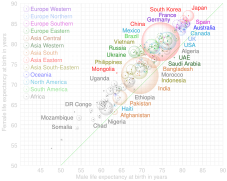 world
world -
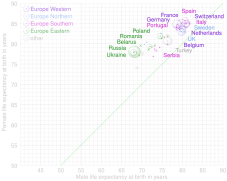 Europe
 -
 Asia and Oceania
 -
 America
 -
 Africa


Bar charts with healthy life expectancy (HALE) edit
-
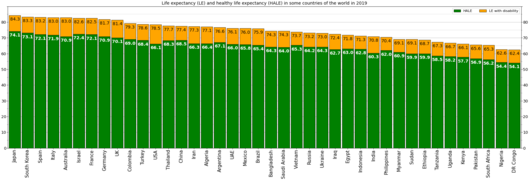 world
world -
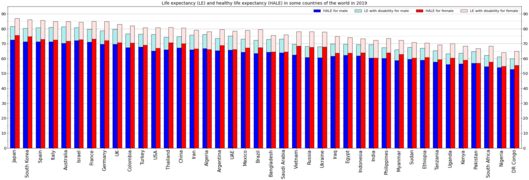 world
world
(by sex) -
 Europe
 -
 Europe
(by sex) -
 European Union
 -
 European Union
(by sex) -
 Asia
Asia -
 Asia
Asia
(by sex) -
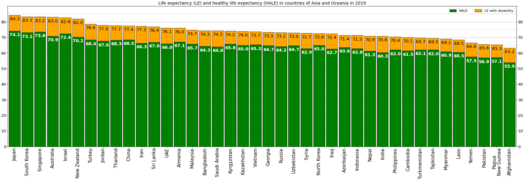 Asia and Oceania
 -
 Asia and Oceania
(by sex) -
 America
 -
 America
(by sex) -
 Latin America
 -
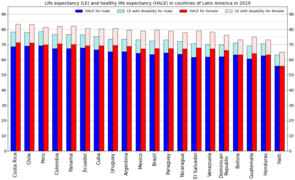 Latin America
(by sex) -
 Africa
 -
 Africa
(by sex) -
 CIS (Commonwealth of Independent States)
 -
 CIS
CIS
(by sex) -
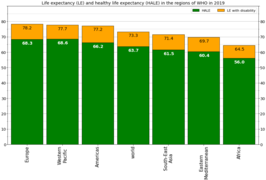 WHO regions
 -
 WHO regions
(by sex)


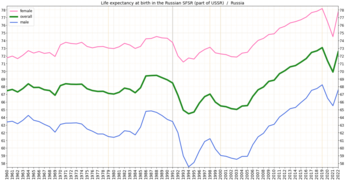
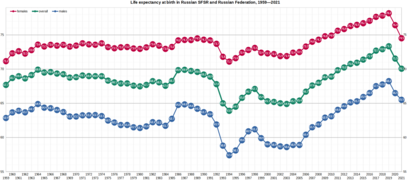
Charts for Russia edit
-
 1960-2021
(WBG) -
 1960-2021,
sex gap
(WBG) -
1960-2021, vs leader,
sex gap
(WBG) -
 1959–2021
(HMD & Rosstat)
(LibreOffice Calc design) -
 1959–2021
(HMD & Rosstat)
(Matplotlib design) -
 1959–2021, vs leader
(HMD & Rosstat) -
 1959-2021,
sex gap (v1)
(HMD & Rosstat) -
 1959-2021,
sex gap (v2)
(HMD & Rosstat) -
 1959-2021, vs leader,
sex gap
(HMD & Rosstat)


_-v2.png)
.png)

_-diff_simple.png)
_-diff.png)

-
 1990–2021
(Rosstat)
(LibreOffice Calc desing) -
 1990–2021
(Rosstat)
(Matplotlib design) -
 1990–2021
urban vs rural data
(Rosstat) -
 1990–2021,
various gaps
(Rosstat)
_-v2.png)
.png)
_-v3.png)
_-v3_-diff.png)
Life expectancy in Russian regions edit
- North Caucasus
-
 Life expectancy in the North Caucasus
 -
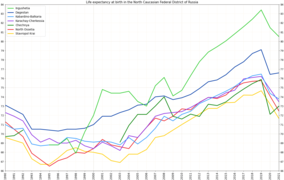 Life expectancy in the North Caucasian Federal District of Russia
 -
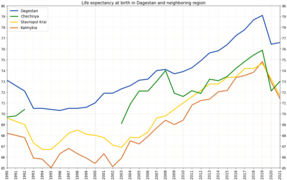 Life expectancy in Dagestan and neighboring regions
 -
 Life expectancy in Chechnya and neighboring regions
 -
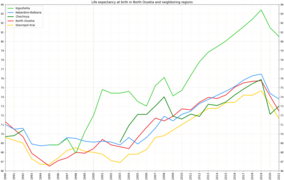 Life expectancy in North Ossetia and neighboring regions


Dagestan, Chechnya, Ingushetia, North Ossetia, Kabardino-Balkaria, Karachay-Cherkessia, Adygea, Krasnodar Krai, Stavropol Krai
- Other southern and south-western regions
-
 Life expectancy in the Southern Federal District of Russia
 -
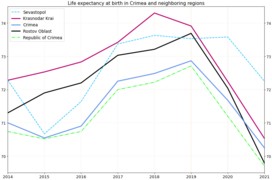 Life expectancy in Crimea and neighboring regions
 -
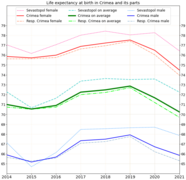 Life expectancy in Crimea and its parts
 -
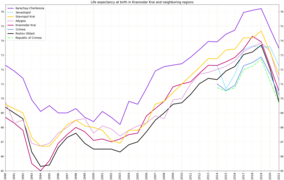 Life expectancy in Krasnodar Krai and neighboring regions
 -
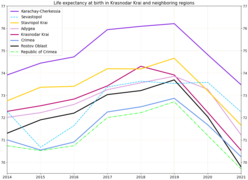 Life expectancy in Krasnodar Krai and neighboring regions (after 2014)


.png)
Crimea, Sevastopol, Republic of Crimea, Rostov Oblast, Belgorod Oblast, Voronezh Oblast, Kursk Oblast, Bryansk Oblast, Oryol Oblast, Kalmykia, Astrakhan Oblast, Volgograd Oblast
- other regions of the European part of Russia
Kaliningrad Oblast, Saint Petersburg, Leningrad Oblast, Vologda Oblast, Yaroslavl Oblast, Moscow, Moscow (after expansion), Moscow Oblast, Nizhny Novgorod Oblast, Samara Oblast, Tatarstan, Bashkortostan
- regions of the Asian part of Russia
Chelyabinsk Oblast, Sverdlovsk Oblast,
Tyumen Oblast, Tyumen Oblast (except 2 AO), Yamalo-Nenets AO, Khanty-Mansi AO,
Novosibirsk Oblast, Kuzbass, Krasnoyarsk Krai, Jewish Autonomous Oblast, Primorsky Krai, Chukotka
Bubble charts of life expectancy for Russia edit
-
 male vs female
 -
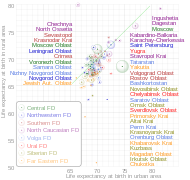 rural vs urban


Other charts edit
-
 Life expectancy in USA by race
(almost all data) -
 Life expectancy in USA by race
(only overall) -
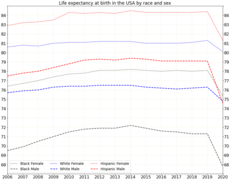 Life expectancy in USA by race
(male and female) -
 Life expectancy in USA by race
(sex gap)


Life expectancy maps edit
Maps for world region edit
-
 world, 2019
 -
 world, 2020
 -
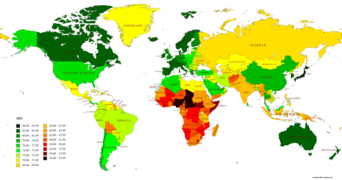 world, 2021
 -
 European Union, 2019
 -
 European Union, 2020
 -
 European Union, 2021
 -
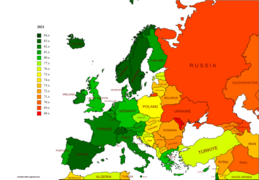
 Europe, 2019
 -
 Europe, 2020
 -
 Europe, 2021
 -
 Europe expanded, 2019
 -
 Europe expanded, 2020
 -
 Europe expanded, 2021
 -
 Asia, 2019
 -
 Asia, 2020
 -
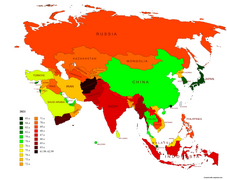 Asia, 2021
 -
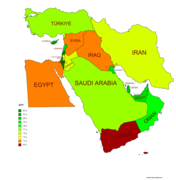 Middle East, 2019
 -
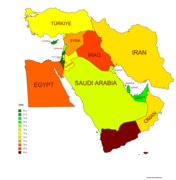 Middle East, 2020
 -
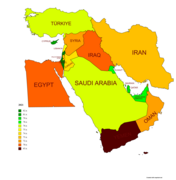 Middle East, 2021
 -
 Oceania, 2019
 -
 Oceania, 2020
 -
 Oceania, 2021
 -
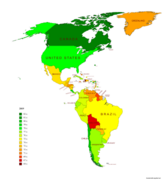 Americas, 2019
 -
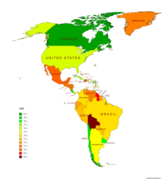 Americas, 2020
 -
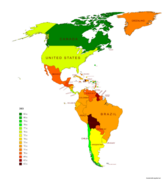 Americas, 2021
 -
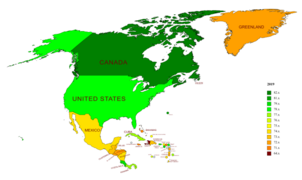 North America, 2019
 -
 North America, 2020
 -
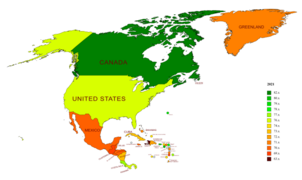 North America, 2021
 -
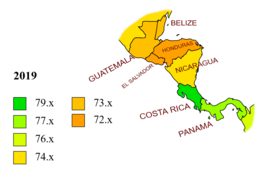 Central America, 2019
 -
 Central America, 2020
 -
 Central America, 2021
 -
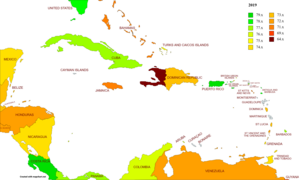 Caribbean, 2019
 -
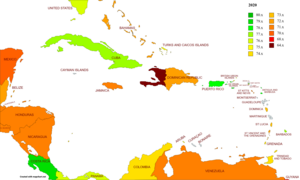 Caribbean, 2020
 -
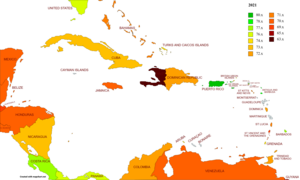 Caribbean, 2021
 -
 Latin America, 2019
 -
 Latin America, 2020
 -
 Latin America, 2021
 -
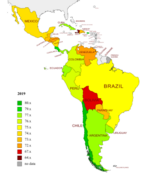
 South America, 2019
 -
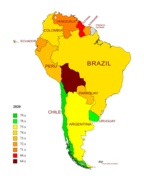 South America, 2020
 -
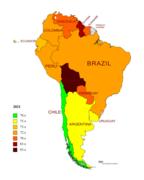 South America, 2021
 -
 Africa, 2019
 -
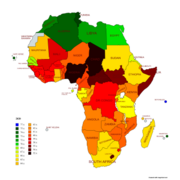 Africa, 2020
 -
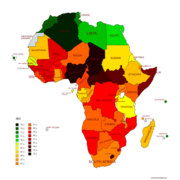 Africa, 2021


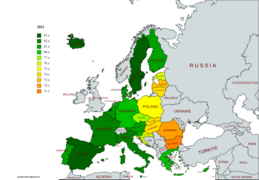
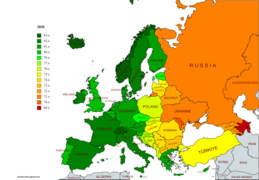
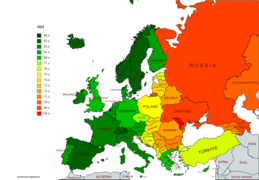
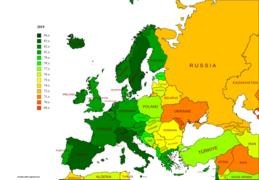
Maps for European regions edit
-
 2017
2017 -
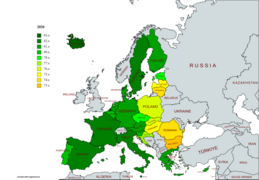
 2018
2018 -
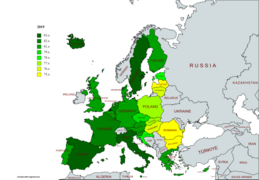
 2019
2019 -
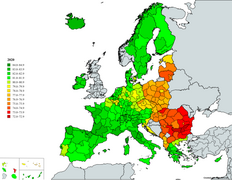 2020
2020 -
 2021
2021


Maps for Russia edit
-
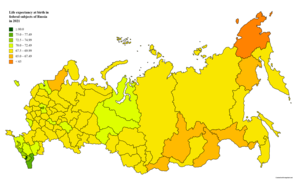
 2019, federal subjects
 -
 2020, federal subjects
 -
 2021, federal subjects
 -
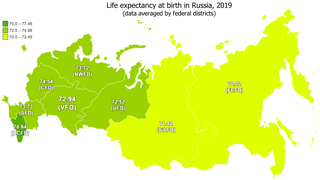 2019, federal districts
 -
 2020, federal districts


-
 2019, federal subjects
(more detailed) -
 2020, federal subjects
(more detailed) -
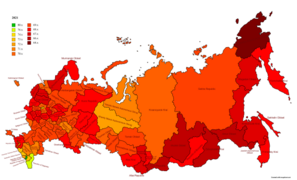 2021, federal subjects
(more detailed)


Maps for Turkey edit
-
 2015-2017
 -
 2018-2020


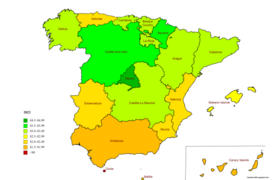
Maps for Spain edit
- by autonomous community
-
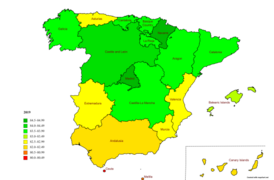 2019
2019 -
 2020
2020 -
 2021
2021 -
 2022
2022


- by province
-
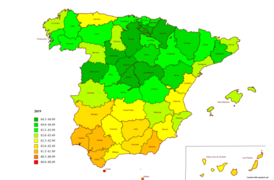 2019
2019 -
 2020
2020 -
 2021
2021 -
 2022
2022


Maps for France edit
- 2022
-
 regions,
male -
 regions,
female -
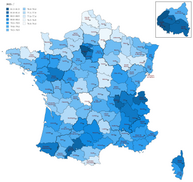 departments,
male -
 departments,
female


Maps for Germany edit
- 2020/2022
-
 male
male -
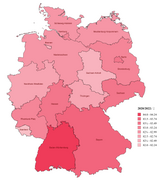 female


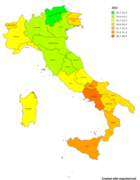
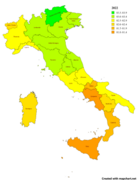
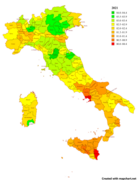
Maps for Italy edit
- by regions
-
 2019
2019 -
 2020
2020 -
 2021
2021 -
 2022
2022


- by provinces
-
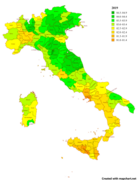 2019
2019 -
 2020
2020 -
 2021
2021 -
 2022
2022


Maps for the United Kingdom edit
-
 2017
2017 -
 2018
2018


(This maps are small modifications of according maps for European regions)
Maps for Australia edit
-
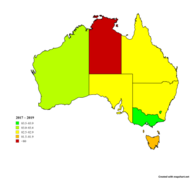 2017 – 2019
 -
 2018 – 2020
 -
 2019 – 2021
 -
 2020 – 2022


Maps for India edit
-
 2015 – 2019
(by SRS) -
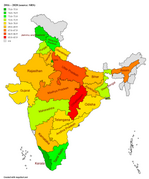 2016 – 2020
(by SRS) -
 2015 – 2016
(by NFHS) -
 2019 – 2021
(by NFHS)


Maps for China edit
-
 2019
2019

Maps for the United States edit
-
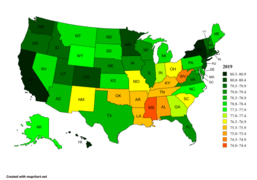 2019
2019 -
 2020
2020


Maps for Canada edit
-
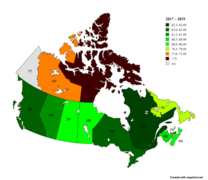 2017 – 2019
 -
 2020 – 2022


Historical info about the Soviet Union edit
-
 USSR
USSR
(WBG) -
 USSR vs leader
(WBG) -
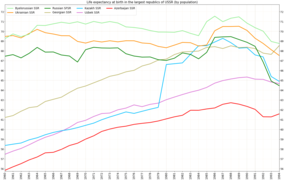
 East Slavic republics vs leader
(WBG) -
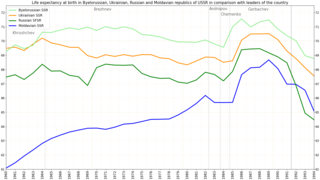 East Slavic & Moldavian republics vs leader
(WBG) -
 South Caucasus republics vs leader
(WBG) -
 Central Asian republics vs leader
(WBG) -
 Bultic republics vs leader
(WBG) -
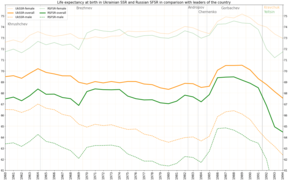 Ukrainian SSR, Russian SFSR vs leader
(WBG) -
 Ukrainian SSR, Russian SFSR vs leader
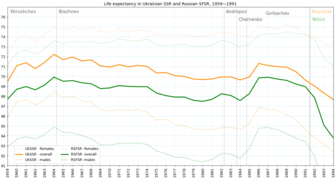
(HMD) -
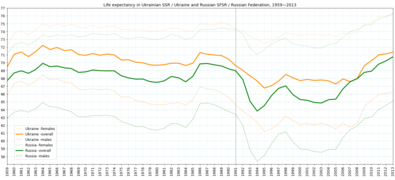 Ukrainian SSR, Russian SFSR
(+ data till 2013)
(HMD)


.png)


Translated biological diagrams edit
That is not my original works but translation of diagrams to Russian language.
-
 Plant cell structure
(v1) -
 Plant cell structure
(v2) -
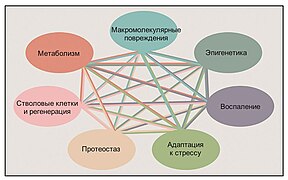
 The Hallmarks of Aging
 -
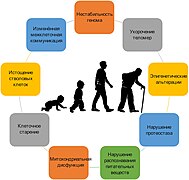
 The Seven Pillars of Aging
 -
 Adrenal gland
 -
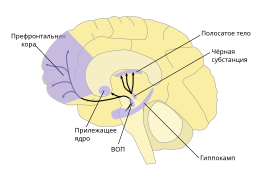 Major dopamine pathways
 -
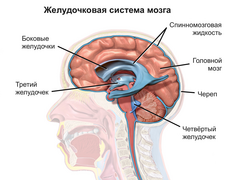 Ventricular system
 -
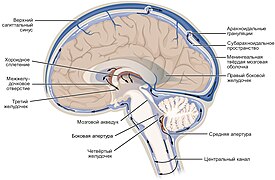
 Cerebrospinal fluid circulation
in a brain (v1) -
 Cerebrospinal fluid circulation
in a brain (v2) -
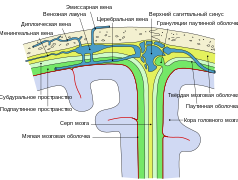 Diagram of a section across the top of the skull
 -
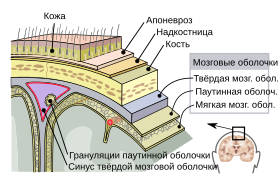 Meninges


.png)


.png)
.png)
My main activity in Wikipedia Commons is related to categories "Life expectancy charts" and "Life expectancy maps".
My profile at English Wikipedia
My profile at Russian Wikipedia
Some my mini-programs for creation of charts are located at GitHub. Feel free to use and modify them for creation of analogous things.
References edit
- ↑ a b c d Life expectancy at birth, total. World Bank Group. "see the visualization tool"
- ↑ a b Life expectancy and Healthy life expectancy, data by country. World Health Organization (4 December 2022).
- ↑ Life expectancy and Healthy life expectancy, data by WHO region. World Health Organization (7 December 2022).
- ↑ a b c Демографический ежегодник России (in ru). Federal State Statistics Service of Russia (Rosstat).
- ↑ a b c Ожидаемая продолжительность жизни при рождении (in ru). Unified Interdepartmental Information and Statistical System of Russia.
- ↑ (8 August 2022). "United States Life Tables, 2020". National Vital Statistics Reports 71 (1): 51. Centers for Disease Control and Prevention. — Table 19
- ↑ a b Life expectancy at birth by sex and NUTS 2 region. Eurostat (22 December 2023). Retrieved on 8 February 2023.
- ↑ Life expectancy at birth by sex and NUTS 2 region. Eurostat (22 December 2023). Retrieved on 8 February 2023. — see visualization tool at Map tab
- ↑ Data Portal for Statistics: Population and Demography. TurkStat. "see statistical tables 'Life expectancy at birth by provinces and sex'"
- ↑ Autonomous Communities of Spain - Life expectancy at birth. CountryEconomy.com.
- ↑ Spanish Statistical Office: Life expectancy at birth by Province and by sex. Spanish Statistical Office.
- ↑ Espérance de vie en 2022: Comparaisons régionales et départementales. National Institute of Statistics and Economic Studies (France). Retrieved on 2024-02-01.
- ↑ Deaths, life expectancy: Life expectancy by sex and state. Federal Statistical Office of Germany. Retrieved on 2024-02-03.
- ↑ Indicatori demografici. Italian National Institute of Statistics. Retrieved on 14 February 2024.
- ↑ Life expectancy, 2020 - 2022. Australian Bureau of Statistics (2023-11-08). Retrieved on 2024-04-04.
- ↑ SAMPLE REGISTRATION SYSTEM (SRS)-ABRIDGED LIFE TABLES 2016-2020. RCCGI (2022-11-01). Retrieved on 2024-04-07. — statement 3, page 6
- ↑ (2023-09-04). "Impact of COVID-19 on subnational variations in life expectancy and life disparity at birth in India: evidence from NFHS and SRS data". Archives of Public Health 81 (1): 165. DOI:10.1186/s13690-023-01170-8. PMID 37667348. PMC: 10476359. — Additional file 1: Supplementary Table S1.
- ↑ Jing Yang, Ruhai Bai, Lijun Wang, Xiaoqi Feng, Yunning Liu, Maigeng Zhou (13 January 2023). Healthy China: A Projection of Life Expectancy Based on the Global Burden of Disease Study 2019 — China, 1990–2030. China CDC Weekly. Retrieved on 12 April 2024. — table 1, page 42
- ↑ (10 February 2022). "U.S. State Life Tables, 2019". National Vital Statistics Reports 70 (18): 3. Centers for Disease Control and Prevention. — Table A
- ↑ (23 August 2022). "U.S. State Life Tables, 2020". National Vital Statistics Reports 71 (2): 3. Centers for Disease Control and Prevention. — Table A
- ↑ Life expectancy and other elements of the complete life table, three-year estimates, Canada, all provinces except Prince Edward Island. Statistics Canada (27 November 2023).
- ↑ Life expectancy and other elements of the abridged life table, three-year estimates, Prince Edward Island and the territories. Statistics Canada (27 November 2023).