Chen-Pan Liao
|
Our first steps tour and our FAQ will help you a lot after registration. They explain how to customize the interface (for example the language), how to upload files and our basic licensing policy. You don't need technical skills in order to contribute here. Be bold contributing here and assume good faith for the intentions of others. This is a wiki—it is really easy. More information is available at the community portal. You may ask questions at the help desk, village pump or on IRC channel #wikimedia-commons (direct access). You can also contact an administrator on their talk page. If you have a specific copyright question, ask at Commons talk:Licensing. |
| |
| (P.S. Would you like to provide feedback on this message?) | ||
Tip: Categorizing images edit

Thanks a lot for contributing to the Wikimedia Commons! Here's a tip to make your uploads more useful: Why not add some categories to describe them? This will help more people to find and use them.
Here's how:
1) If you're using the UploadWizard, you can add categories to each file when you describe it. Just click "more options" for the file and add the categories which make sense:

2) You can also pick the file from your list of uploads, edit the file description page, and manually add the category code at the end of the page.
[[Category:Category name]]
For example, if you are uploading a diagram showing the orbits of comets, you add the following code:
[[Category:Astronomical diagrams]][[Category:Comets]]
This will make the diagram show up in the categories "Astronomical diagrams" and "Comets".
When picking categories, try to choose a specific category ("Astronomical diagrams") over a generic one ("Illustrations").
Thanks again for your uploads! More information about categorization can be found in Commons:Categories, and don't hesitate to leave a note on the help desk.CategorizationBot (talk) 12:28, 6 June 2011 (UTC)
- Image:Boxplot vs PDF.svg was uncategorized on 5 June 2011 CategorizationBot (talk) 12:28, 6 June 2011 (UTC)
Spider silk diagram edit
Hello Chen-Pan Liao! I am editing the English Wikipedia article on Spider Silk. Your image is very beautiful, but is slightly wrong. Do you still have the vector source file?
What needs to be done: The strings between the beta sheet blocks are good, but need to be changed slightly. They should come in at the ends of the beta sheets, parallel to the zig-zag lines (from the left and the right). This is shown on the diagram already. They should not come to the sides of the beta sheets (top and bottom of the beta sheet blocks in your diagram). This does not happen in the paper you cite, and is not current understanding of the model in the scientific literature.
If you still have the image source file please could you change it?
If you do not have the file or are too busy I will change the image in one week. I will change it to how I describe above.
你好! 我正在阅读Wikipedia关于Spider silk的文章。你画的蜘蛛丝的结构图非常漂亮,但是有一点小问题,希望你能够修改一下,如果你还有原始的可编辑矢量图。 我现在描述一下这个问题: 你的结构很简单明了,其中两种基本结构是晶体和无定形区。这里的晶体结构叫做β-sheet,是由蜘蛛丝蛋白分子的片段折叠而成的,所以每个β-sheet只有一个头一个尾。经典的比较公认的蜘蛛丝结构是反平行β-sheet,也就是从一角开始,遇到丙氨酸就可以转角180度,如此反复,就形成这个结晶结构。你可以去掉每个晶体中多余的线头只留一头一尾吗?还有就是,这个结构可能很明了,但是并不代表最新的科学研究,也不能够解释很多复杂现象,但作为wikipedia的科普文章,服务大家的科学兴趣是足够了。我的初衷是希望这篇Spider silk的文章更加科学,更加准确。
如果你没有原始的矢量图,还请问我可以修改你的图片吗,如果我在一周内没有收到你的答复?
best wishes
vincentsarego (do I have to make a separate account for the Commons?) 129.67.25.1 14:58, 17 June 2011 (UTC)
- 致vincentsarego。非常謝謝您的指教。為了方便將來的討論,我已把我們的對話放在File talk:Structure of spider silk thread.svg,請將來在該處繼續討論,以利將來對其它對該圖有興趣的維基人會有所幫助。Apan (talk) 19:53, 17 June 2011 (UTC)
This message was added automatically by Nikbot, if you need some help about it please read the text above again and follow the links in it, if you still need help ask at the ![]() → Commons:Help desk in any language you like to use. --Nikbot 12:20, 11 November 2011 (UTC)
→ Commons:Help desk in any language you like to use. --Nikbot 12:20, 11 November 2011 (UTC)
Picture of the Year 2013 R1 Announcement edit
P-value in statistical significance testing edit

Hi there, I noticed that you have updated the image in the article on p-value. Thank you very much for the effort. However, I also noticed a few spelling errors: in the paragraph inside the box, "bypothesis" should be "hypothesis", "commiting" should be "committing", and "rerult" should be "result". In the labeling of the figure, there is "more likely ovservation" which should be "more likely observation". Lastly, I would be very grateful if you could modify the caption of figure to be: "A p-value (shaded green area) is the probability of an observed (or more extreme) result assuming that the null hypothesis is true." Cheers, (Manoguru (talk) 13:12, 23 November 2014 (UTC))
- Hi Manoguru, many thanks for your advices. I've corrected these typos and updated this figure on wikipedia commons. Apan (talk) 21:47, 23 November 2014 (UTC)
Questions about File:Northern Hemisphere Azimuthal projections.svg. edit
Hi! Thank you for making File:Northern Hemisphere Azimuthal projections.svg; I'm trying to learn R, and making beautiful SVG maps (especially choropleth maps!) is definitely going to be part of that.
The code you included in the description doesn't produce the file that you uploaded; R appears to plot the entire outline of any shape that intersects the region to be drawn; I'm guessing that you put the transparent mask over the top of the image afterwards in Inkscape. (I wonder if there's a way to do that in the R code.) Also, the grid appears over, not under, the country shapes, and setting nx and ny to zero draws the grid in the wrong place (and the wrong color). Any help you could provide in replicating how you made that diagram would be greatly appreciated. Thanks! grendel|khan 02:17, 9 August 2016 (UTC)
- Hi khan. In fact, this SVG was made by using R first and then using Inkscape to do many modifications. That's saying, I only used R to draw the lines and shapes (especially the outlines of nations), and then used Inkscape to make the figure readable and clean a lot redundant objects. That's why the R code I provided cannot produce the final SVG. Apan (talk) 08:22, 9 August 2016 (UTC)
Wiki Science Competition 2017 has started in Asia edit
It is a world event.
This is a manually inserted message for Asian commons users with knowledge of the English language who are also globally active and who have uploaded images related to the competition's theme (science building, microscopic images, wildlife...).
|
Permission to use picture of spider web -- need signed release for publisher edit
Hi Chen-Pan Liao,
I'm working on a book for school teachers about engineering and nature, and would love to use an image of yours. It's this image:
https://commons.wikimedia.org/wiki/File:Typical-orb-web-photo.jpg
Even though you've kindly made this a Creative Commons image, the publisher requires I get a signed release for any images used in the book. Can I send it to you to sign? My email is samstier@gmail.com (samstier at gmail dot com).
Thanks! Sam

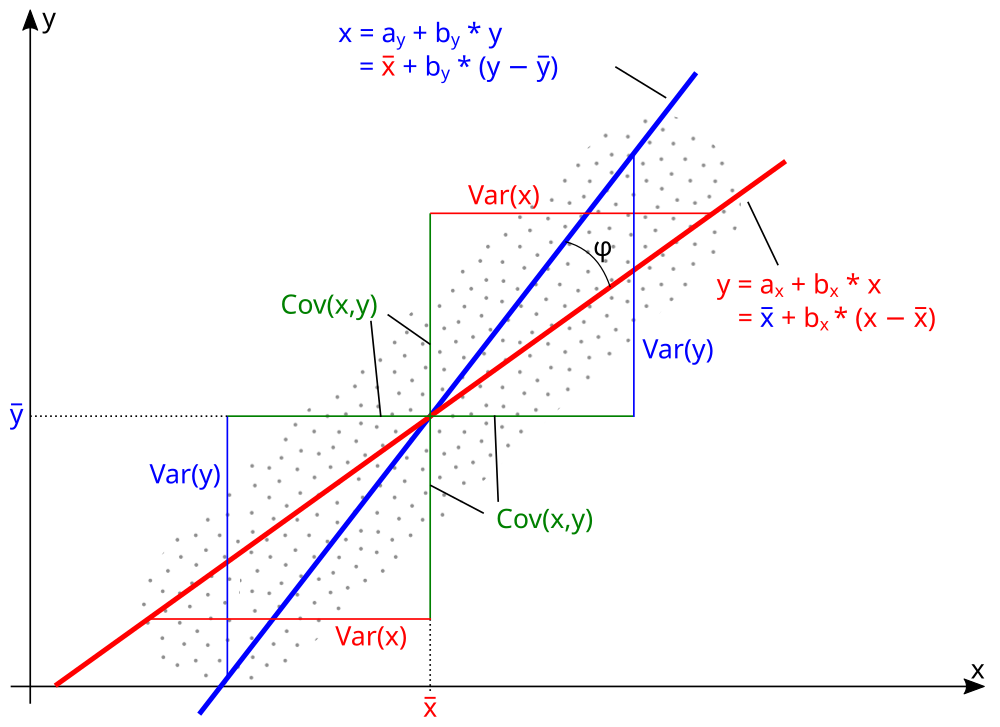
Hi there, and thanks for creating this SVG-version of my PNG. Is it possible to bring the "y" in "x = a y..." closer to the "a", and the "x" in "x = a x..." closer to the "a"? And the overbars upon the red x and blue y in the lines below, could they be placed more accurately - at the moment they are slightly shifted to the left. But once again, many thanks for your effort, and greetings. --Qniemiec (talk) 11:46, 2 November 2021 (UTC)
- IIRC,
librsvgdoes not display theoverlineproperty correctly. For this file, I would encode reasonable SVG even iflibrsvgdoes not handle it. When I display the file in my browser, the overlines are even worse. Possible trick is to use U0305 as in x̅. Glrx (talk) 18:49, 2 November 2021 (UTC)
- To Glrx, It seems U+0305 works well in Inkscape. Many thanks. Just in case, I converted the two equations from texts to outlines. To, Qniemiec, thanks for let me know. Please check the updated version. Apan (talk) 02:35, 3 November 2021 (UTC)
- I don't like converting text to curves, but it does get around some problems with
librsvg. Glrx (talk) 04:33, 3 November 2021 (UTC)
- I don't like converting text to curves, but it does get around some problems with
- To Glrx, I agree that converting to outlines is not the best way. However, I cannot fix the problem which an unexpected space some how existed between normal text and subscript text, for instance, was rendered like . If you know a better solution to render math equation inside SVG for wikipedia, especially Inkscape can deal with, please let me know and I'll give a try. Thank you. Apan (talk) 08:06, 3 November 2021 (UTC)


- Hi there, now it looks very nice, thank you. And as far as it concerns myself, I rarely rely on the results of entering a text within a graphics processor - in most cases one has to adjust the result later on manually in order to let it look good although this always costs additional effort. But here in Wikimedia we are working for eternity, so what do count some extra hours spent behind screen, ain't I'm right? ;-) --Qniemiec (talk) 14:44, 3 November 2021 (UTC)
- @Chen-Pan Liao and JoKalliauer:
- I think it is better to use the text rather than the curves. For example, with the text, others can change the text to use the more typical italic font for variables (i.e., x instead of x) and a more traditional multiplication symbol instead of the typical computer language operator (i.e., × or · instead of
*). - I took a closer look at the SVG for your text version:
- The SVG looks OK (well, the text should not be stroked, the text anchors are off, and there are spaces within the subscripts) and renders appropriately in my browser. The U0305 bars are slightly skewed to the right but are acceptable. Curiously, the "ax" renders with a medial space, but the "bx" renders correctly. That suggests there is a
librsvgbug. Commons is using a very outdated version oflibrsvg; It is possible that the current version oflibrsvgdoes not have the bug. It is also possible that it is a new bug. I'll look further, but I do not see a subscript bug in the list of librsvg bugs. (Might be a small font bug?) - The relevant SVG is
<text
       xml:space="preserve"
       style="font-size:5.64444px;font-family:sans-serif;text-anchor:middle;fill:#ff0000;stroke-width:0.264583"
       x="173.07393"
       y="75.518623"><tspan
         sodipodi:role="line"
         style="font-size:5.64444px;text-anchor:start;fill:#ff0000;stroke-width:0.264583"
         x="173.07393"
         y="75.518623">y = a<tspan
   style="font-size:65%;baseline-shift:sub">x</tspan> + b<tspan
   style="font-size:65%;baseline-shift:sub">x</tspan> * x</tspan><tspan
         sodipodi:role="line"
         style="font-size:5.64444px;text-anchor:start;fill:#ff0000;stroke-width:0.264583"
         x="173.07393"
         y="82.574173">   = <tspan
   style="fill:#0000ff">x̅</tspan> + b<tspan
   style="font-size:65%;baseline-shift:sub">x </tspan>* (x − x̅)</tspan></text>
- Glrx (talk) 20:12, 3 November 2021 (UTC)
- @Glrx: Compare the "ax"
- They render differently that seems to be a symptom of phab:T36947, which got fixed with the version of librsvg2.50.6
- @Chen-Pan Liao: please follow the instructions regarding font-size at Wikipedia:SVG_help#bad_letter-alignment_on_small_font-size.
- — Johannes Kalliauer - Talk | Contributions 20:51, 3 November 2021 (UTC)
- @JoKalliauer: Yes, it looks like the small font size bug. Thanks for investigating.
- Glrx (talk) 23:07, 3 November 2021 (UTC)
@JoKalliauer: @Glrx: @Qniemiec: Thank you all guys. The updated version looks great.