Category:Charts showing data through 2023
Deutsch: Statistiken bis zu und einschließlich 2023. Viele Grafiken fehlen hier noch – bitte hinzufügen.
English: Charts showing data up to and including 2023.
- Many charts are still missing – please help categorizing charts, e.g. from here. Outdated charts can often be updated. Only charts on notable subjects with specified data source(s) should be included.
| NO WIKIDATA ID FOUND! Search for Charts showing data through 2023 on Wikidata | |
| Upload media |
Subcategories
This category has the following 3 subcategories, out of 3 total.
C
- CWS metrics charts (7 F)
W
Media in category "Charts showing data through 2023"
The following 46 files are in this category, out of 46 total.
-
1880- Global surface temperature - heat map animation - NASA SVS.webm 30 s, 3,840 × 2,160; 35.15 MB
-
 1940-2023 Global surface temperature - stacked - Copernicus.jpg 3,060 × 1,980; 381 KB
-
 2023 climate change related Earth system records.jpg 1,750 × 2,366; 591 KB
-
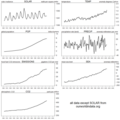 7 world series from our world in data.png 1,116 × 1,115; 81 KB
-

-
 Antarctic-sea-ice-extent 2016-2023.jpg 1,240 × 640; 135 KB
-
 Anzahl verkaufter Fahrräder und Ebikes in De bis 2022.svg 620 × 319; 54 KB
-
 Arrivals into the EU via the Mediterranean from 2008 onwards (UNHCR).svg 1,728 × 878; 45 KB
-
 Bitcoin electricity consumption.svg 810 × 630; 412 KB
-

-

-
 ClimateDashboard-Antarctic-sea-ice-summer-minimum-graph-20230307-1400px.jpg 1,400 × 1,200; 252 KB
-
 Co2-long-term-concentration.png 3,400 × 2,400; 655 KB
-
 Commons Growth.svg 800 × 600; 35 KB
-
 Divestment growth en.svg 1,200 × 600; 41 KB
-
 Era5 global sfc temp monthly anomalies all months 1940-2023 dark.pdf 1,275 × 825; 98 KB
-
 Era5 global sfc temp monthly anomalies october 1940-2023.pdf 1,275 × 825; 90 KB
-
 Estimated training cost of some AI models - 2024 AI index.jpg 2,560 × 1,361; 147 KB
-

-
 GBR rail passengers by year 1830-2023.png 1,020 × 569; 54 KB
-
-
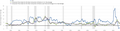
 H5n1-flu-reported-cases.gif 3,400 × 2,700; 537 KB
-
 Hats ccl4 global.png 695 × 406; 57 KB
-
 Hats f11 global.png 695 × 405; 42 KB
-
 Hats f113 global.png 695 × 405; 37 KB
-
 Hats f12 global.png 695 × 405; 40 KB
-
 HATS Nitrous Oxide concentration.png 695 × 406; 57 KB
-
 M2, CPI, PCE.webp 3,853 × 1,006; 118 KB
-
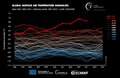
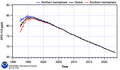
 Monthly-surface-temperature-anomalies-by-year.png 3,400 × 2,400; 2.2 MB
-
 Nanosatellites launched by years.png 2,560 × 1,440; 120 KB
-
 Netherlands electricity generation by source.png 920 × 506; 57 KB
-
 Neue Artikel pro Tag in dewiki 02 (fcm).png 1,587 × 965; 95 KB
-
 Nuclear Energy by Year.svg 1,072 × 593; 937 KB
-
 Pandemics-Timeline-Death-Tolls-OWID 9818.png 9,818 × 13,400; 2.58 MB
-
 Pandemics-Timeline-Death-Tolls-OWID 9818.webp 9,818 × 1,112; 798 KB
-
 Personal consumption expenditures price index.webp 3,853 × 1,020; 107 KB
-
 Strommix-deutschland-seit2015.svg 800 × 540; 107 KB
-
 Sulfur Hexafluoride concentration.png 695 × 406; 51 KB
-
 Tatoeba in machine translation articles.svg 540 × 360; 17 KB
-
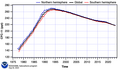
 Temperature-anomaly.png 3,400 × 2,400; 818 KB
-
-

-

-
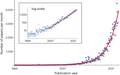
 Trend toward ever larger data sets in astronomy (noao1901b).tiff 2,820 × 1,824; 5.08 MB
-
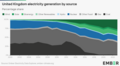 United Kingdom electricity generation by source.png 920 × 506; 62 KB
-
 US and UK enwiki views.png 551 × 455; 32 KB


.svg)


.png)


