Category:Demographic maps of Italy
Countries of Europe: Albania · Armenia‡ · Austria · Azerbaijan‡ · Belarus · Bosnia and Herzegovina · Bulgaria · Croatia · Cyprus‡ · Czech Republic · Denmark · Estonia · Finland · France‡ · Georgia‡ · Germany · Greece · Hungary · Iceland · Republic of Ireland · Italy · Kazakhstan‡ · Latvia · Lithuania · Luxembourg · Moldova · Montenegro · Netherlands‡ · North Macedonia · Norway · Poland · Portugal‡ · Romania · Russia‡ · Serbia · Slovakia · Slovenia · Spain‡ · Sweden · Switzerland · Turkey‡ · Ukraine · United Kingdom
Limited recognition: Kosovo
‡: partly located in Europe
Limited recognition: Kosovo
‡: partly located in Europe
Subcategories
This category has the following 9 subcategories, out of 9 total.
*
- Demographic maps of Sardinia (5 F)
E
L
- Life expectancy maps of Italy (17 F)
M
P
- Population density maps of Italy (29 F)
R
- Religion maps of Italy (2 F)
S
- Surname maps of Italy (6 F)
Media in category "Demographic maps of Italy"
The following 99 files are in this category, out of 99 total.
-
 45332601nd7 (1).jpg 815 × 972; 276 KB
-

-
 Anthropological maps of Italy.png 2,356 × 1,600; 2.59 MB
-
 Aplogruppi J2+E3b in Italia.jpg 237 × 315; 86 KB
-
 BiasuttiMappa.png 1,197 × 1,430; 1.45 MB
-
-
 Blond hair Italy.png 1,197 × 1,430; 97 KB
-
 Blue & Gray eyes Sardinia Livi.png 387 × 655; 335 KB
-
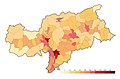 Bolzano-Den.jpg 1,500 × 982; 145 KB
-
 Bolzano-Pop.jpg 1,500 × 982; 149 KB
-
 Bolzano-Var.jpg 1,500 × 982; 141 KB
-
 Brown hair Italy in 1863.png 1,082 × 1,312; 805 KB
-
 Carta degli Abitanti delle Regioni d'Italia (2011).png 750 × 650; 29 KB
-
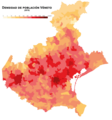 Densidad Véneto.png 2,000 × 2,141; 506 KB
-
 Densita Veneto.png 2,000 × 2,141; 505 KB
-
 Distribuzione-centri-emofilia-sul-territorio-nazionale.jpg 2,048 × 2,560; 1,009 KB
-
 H1N1 Italy Map.svg 735 × 867; 51 KB
-
 Italian provinces by population (2011).png 5,300 × 6,785; 2.63 MB
-
 Italien-Pro-Kopf-Einkommen-nach-Regionen.png 606 × 600; 104 KB
-
 Italien.jpg 572 × 734; 137 KB
-

-
 Jewish communities in Italy.jpg 1,000 × 1,217; 179 KB
-
 Lombardia-Densita-ES.jpg 1,500 × 1,363; 279 KB
-
 Lombardia-Densita.jpg 1,500 × 1,363; 279 KB
-
 Lombardia-Popolazione-ES.jpg 1,500 × 1,363; 292 KB
-
 Lombardia-Popolazione.jpg 1,500 × 1,363; 293 KB
-
 Lombardia-variazione-ES.jpg 1,500 × 1,363; 359 KB
-
 Lombardia-variazione.jpg 1,500 × 1,363; 359 KB
-

-
 Map Age and sex composition of the population 1990 - Touring Club Italiano CART-TEM-042.jpg 2,811 × 1,988; 4.24 MB
-

-

-
 Map Demographic synthesis 1992 - Touring Club Italiano CART-TEM-046.jpg 5,000 × 3,378; 9.5 MB
-

-

-

-

-
 Map Family structure 1990 - Touring Club Italiano CART-TEM-043.jpg 5,000 × 3,406; 10.24 MB
-
 Map Health I 1992 - Touring Club Italiano CART-TEM-037.jpg 5,000 × 3,265; 9.15 MB
-
 Map Health II 1992 - Touring Club Italiano CART-TEM-038.jpg 5,000 × 3,362; 9.49 MB
-
 Map Historical evolution of settlements I 1992 - Touring Club Italiano CART-TEM-049.jpg 1,820 × 1,274; 2.44 MB
-

-

-

-
-

-
 Map Historical evolution of settlements II 1992 - Touring Club Italiano CART-TEM-050.jpg 3,000 × 2,064; 4.64 MB
-
 Map Migration I 1990 - Touring Club Italiano CART-TEM-040.jpg 5,000 × 3,362; 9.47 MB
-
 Map Migration II 1990 - Touring Club Italiano CART-TEM-041.jpg 5,000 × 3,447; 10.62 MB
-
 Map Population distribution I 1989 - Touring Club Italiano CART-TEM-047.jpg 5,000 × 3,355; 11.76 MB
-
 Map Population distribution II 1989 - Touring Club Italiano CART-TEM-048.jpg 2,344 × 1,691; 3.13 MB
-
 Map Urban development - Bari and Palermo 1992 - Touring Club Italiano CART-TEM-059.jpg 5,000 × 3,273; 9.91 MB
-
-

-

-

-

-

-

-
 Map Urban development - Milano 1992 - Touring Club Italiano CART-TEM-054.jpg 5,000 × 3,367; 12.8 MB
-
-
 Map Urban development - Napoli 1992 - Touring Club Italiano CART-TEM-058.jpg 5,000 × 3,394; 11.56 MB
-

-

-
 Map Urban development - Roma 1992 - Touring Club Italiano CART-TEM-057 (cropped).jpg 2,846 × 2,226; 5.76 MB
-
 Map Urban development - Roma 1992 - Touring Club Italiano CART-TEM-057.jpg 5,000 × 3,397; 11.46 MB
-
 Map Urban development - Torino and Genova 1992 - Touring Club Italiano CART-TEM-053.jpg 5,000 × 3,302; 11.46 MB
-

-
-
-
 Map Urban development - Venezia 1992 - Touring Club Italiano CART-TEM-055.jpg 5,000 × 3,280; 10.76 MB
-

-
-

-
 Map Urban system 1990 - Touring Club Italiano CART-TEM-052.jpg 5,000 × 3,279; 9.07 MB
-
 Map Workforce and employment I 1989 - Touring Club Italiano CART-TEM-044.jpg 3,000 × 2,070; 4.28 MB
-
 Map Workforce and employment II 1989 - Touring Club Italiano CART-TEM-045.jpg 5,000 × 3,274; 10.52 MB
-
 Mappa delle stature - Italia.png 804 × 937; 31 KB
-
 Mappa statura Italia.jpeg 804 × 937; 56 KB
-

-
 Origine e diffusione del cognome Gelmini.svg 460 × 600; 870 KB
-
 PIB par habitant Italie 2004.jpg 454 × 585; 124 KB
-
 Población Veneto.png 2,000 × 2,141; 555 KB
-
 POPOLATION PROVINCES OF ITALY.png 1,777 × 2,025; 163 KB
-
 Popolazione province.png 1,500 × 1,933; 364 KB
-
 Popolazione province.svg 512 × 660; 293 KB
-
 Popolazione Veneto.png 2,000 × 2,141; 553 KB
-
 PSM V51 D742 Cephalic index of italy.png 2,227 × 2,589; 489 KB
-
 PSM V51 D745 Relative frequency of brunet traits.png 2,247 × 2,563; 465 KB
-
 PSM V51 D746 Relative frequency of tall statures.png 2,234 × 2,556; 481 KB
-
 Trentino-Sudtirol-DEN.jpg 1,500 × 1,621; 293 KB
-
 Trentino-Sudtirol-POP.jpg 1,500 × 1,621; 298 KB
-
 Trentino-Sudtirol-VAR.jpg 1,500 × 1,621; 295 KB
-
 Trento-Densita.jpg 1,500 × 1,364; 242 KB
-
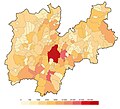 Trento-Popolazione.jpg 1,500 × 1,364; 244 KB
-
 Trento-Variazione.jpg 1,500 × 1,364; 251 KB
-
 Variación población Véneto.png 2,000 × 2,141; 729 KB
-
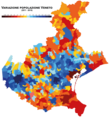 Variazione Veneto.png 2,000 × 2,141; 729 KB
-
 Émigration italienne au Brésil (1876-1920).jpg 551 × 702; 173 KB
.jpg)
%27_(11248027103).jpg)


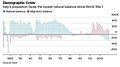
_-_Italy%27s_natural_and_migratory_balance_(1913-2019).jpg)


.png)


.png)


.jpg)


.jpg)
.jpg)
.jpg)
.jpg)


.jpg)
.jpg)
.jpg)
.jpg)
.jpg)


.jpg)
.jpg)
.jpg)
.jpg)
.jpg)
.jpg)

.jpg)

.jpg)
.jpg)
.jpg)


.jpg)
.jpg)
.jpg)

.jpg)
.jpg)
.jpg)


.jpg)
.jpg)