Category:Demographic maps of Ukraine
Countries of Europe: Albania · Armenia‡ · Austria · Azerbaijan‡ · Belarus · Bosnia and Herzegovina · Bulgaria · Croatia · Cyprus‡ · Czech Republic · Denmark · Estonia · Finland · France‡ · Georgia‡ · Germany · Greece · Hungary · Iceland · Republic of Ireland · Italy · Kazakhstan‡ · Latvia · Lithuania · Luxembourg · Moldova · Montenegro · Netherlands‡ · North Macedonia · Norway · Poland · Portugal‡ · Romania · Russia‡ · Serbia · Slovakia · Slovenia · Spain‡ · Sweden · Switzerland · Turkey‡ · Ukraine · United Kingdom
Limited recognition: Kosovo
‡: partly located in Europe
Limited recognition: Kosovo
‡: partly located in Europe

|
All demographic map images in this category could be re-created using vector graphics as SVG files. This has several advantages; see Commons:Media for cleanup for more information. If an SVG form of this image is available, please upload it and afterwards replace this template with
{{vector version available|new image name}}. |
Subcategories
This category has the following 4 subcategories, out of 4 total.
D
E
L
P
Media in category "Demographic maps of Ukraine"
The following 191 files are in this category, out of 191 total.
-
 1897-2001 Укр міста.png 2,664 × 1,806; 2.51 MB
-
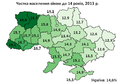
 Aging2013ukraine.png 1,077 × 826; 112 KB
-
 Allcatholic2010.PNG 571 × 434; 31 KB
-
 Allethnoses1897ua.PNG 545 × 423; 34 KB
-
 Allortodox2010.PNG 571 × 434; 34 KB
-
 Allprotestant2010.PNG 571 × 434; 33 KB
-
 Armenians2001ua.PNG 571 × 434; 36 KB
-
 BirthRate2003ua.PNG 571 × 434; 41 KB
-
 BirthRate2010ua.PNG 571 × 434; 45 KB
-
 Bolgarianlang2001ua.PNG 571 × 434; 38 KB
-
 BornBelarus2001.PNG 571 × 434; 36 KB
-
 BornDonbass2001.PNG 571 × 434; 35 KB
-
 BornGalicia2001.PNG 571 × 434; 36 KB
-
 BornKyiv2001.PNG 571 × 434; 42 KB
-
 BornLeftBankCenter2001.PNG 571 × 434; 36 KB
-
 BornPoland2001.PNG 571 × 434; 37 KB
-
 BornRightBankCenter2001.PNG 571 × 434; 38 KB
-
 BornShare2001.PNG 572 × 422; 35 KB
-
 BornSouth2001.PNG 571 × 434; 38 KB
-
 BornVolhynia.PNG 571 × 434; 36 KB
-
 BuchachRaion1989-2001dynamics.PNG 383 × 500; 14 KB
-
 Bucovethn.png 350 × 563; 17 KB
-
 Budjak etnico.png 571 × 490; 36 KB
-
 Cernovicka oblast narodnosti.png 946 × 544; 43 KB
-
 COB data Ukraine.PNG 1,357 × 628; 62 KB
-
 Crime rate Ukraine 2019.png 1,150 × 789; 60 KB
-
 CrimeaLanguagesCensus2001detailed.PNG 1,125 × 687; 892 KB
-
 Crimtatarlang2001ua.PNG 571 × 434; 37 KB
-
 Deathrate2009urb-rur.PNG 571 × 434; 39 KB
-
 DeathRate2010ua.PNG 571 × 434; 44 KB
-
 Deathtobirth2003ua.PNG 537 × 435; 39 KB
-
 Deathtobirth2010ua.PNG 535 × 435; 38 KB
-
 DemographicBurden2013ua.png 1,084 × 869; 109 KB
-
 Displacement situation Ukraine.png 859 × 668; 458 KB
-
 Divorce2010ua.PNG 571 × 434; 46 KB
-
 Ethnic-Ukrainians.jpg 3,000 × 1,708; 987 KB
-
 Ethnicgermans1897.PNG 553 × 446; 33 KB
-
 Ethnicjews1897.PNG 553 × 446; 33 KB
-
 Ethnicukrainian2001.PNG 1,063 × 877; 106 KB
-
 Ethnicukrainians1959.PNG 575 × 442; 41 KB
-
 Ethnographic Map of Ukraine.png 3,460 × 2,096; 1.58 MB
-
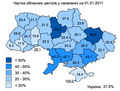
 ExtramaritalBirth2011ua.PNG 571 × 434; 31 KB
-
 Fertility2010ua.PNG 570 × 821; 56 KB
-
 Fertilityrate1990.png 571 × 434; 34 KB
-
 Fertilityrate2000.png 571 × 434; 33 KB
-
 Fertilityrate2009.png 571 × 434; 34 KB
-
 Fertilityrate2011ua.PNG 571 × 434; 35 KB
-
 Fromrussia2001.PNG 571 × 434; 37 KB
-
 Fromukraine2001.PNG 571 × 434; 40 KB
-
 Hungarianlang2001ua.PNG 571 × 434; 38 KB
-
 Infant-Mortality.PNG 571 × 434; 27 KB
-
 Kyiv1989placeofbirth.PNG 573 × 413; 35 KB
-
 Kyiv2001placeofbirth.PNG 573 × 413; 35 KB
-
 Landagriculture2008.PNG 571 × 434; 38 KB
-
 Map Ukraine by population.png 883 × 589; 130 KB
-
 Mapa-miast-ukrainy.png 2,591 × 1,765; 102 KB
-
 MigrationGrowth2011ua.PNG 571 × 434; 45 KB
-
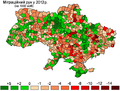 MigrationGrowth2012ua.PNG 571 × 434; 44 KB
-
 Muslim2010.PNG 571 × 434; 30 KB
-
 Natgrowth2009urban.PNG 571 × 434; 33 KB
-
 Nativelanguage2001ua.PNG 1,072 × 770; 60 KB
-
 Natural Growth 2010.PNG 571 × 434; 45 KB
-
 Natural Growth Volyn 2007.PNG 398 × 474; 44 KB
-
 NaturalGrowth2003.PNG 571 × 434; 43 KB
-
 NaturalGrowth2009rural.PNG 571 × 434; 42 KB
-
 NaturalGrowth2009urban.PNG 571 × 434; 46 KB
-
 NaturalGrowth2010.PNG 571 × 434; 45 KB
-
 NaturalGrowth2011.PNG 571 × 434; 43 KB
-
 NaturalGrowth2012.PNG 571 × 434; 44 KB
-
 NobilityYiddish1897.PNG 539 × 395; 28 KB
-
 Nonukrainian2001 ru.PNG 540 × 447; 43 KB
-
 Nonukrainian2001.PNG 540 × 447; 39 KB
-
 OblastCenterChangeUa1989-2011.png 571 × 434; 35 KB
-
 Oblastcenterpop2011.png 571 × 434; 34 KB
-
 OblastDynamics1926-1939ua.PNG 571 × 434; 20 KB
-
 OblastDynamics1939-1959ua.PNG 571 × 434; 22 KB
-
 OblastDynamics1959-1970ua.PNG 571 × 434; 21 KB
-
 OblastDynamics1970-1979ua.PNG 571 × 434; 21 KB
-
 OblastDynamics1979-1989ua.PNG 571 × 434; 21 KB
-
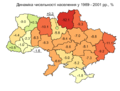 OblastDynamics1989-2001ua.PNG 571 × 434; 21 KB
-
 Odeska oblast narodnosti.png 858 × 982; 66 KB
-
 OverallGrowth2012.PNG 571 × 434; 45 KB
-
 OverallPopGrowth2011ua.PNG 571 × 434; 45 KB
-
 PEREPUS 1897-2.jpg 1,310 × 1,073; 266 KB
-
 PEREPUS 1897.jpg 1,310 × 1,073; 502 KB
-
 Poles1897ua2.PNG 553 × 446; 31 KB
-
 Poles1959ua.PNG 567 × 449; 37 KB
-
 Populat8910.PNG 572 × 450; 44 KB
-
 Population density of Ukraine oblasts.png 6,364 × 5,419; 1.26 MB
-
 RaionsEdited.GIF 573 × 450; 30 KB
-
 RakhivRaion1989-2001dynamics.PNG 668 × 630; 23 KB
-
 RipkyRaion1989-2001dynamics.PNG 772 × 797; 31 KB
-
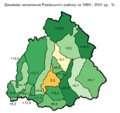
 RivneOblastPopulationMedianAge.PNG 354 × 421; 44 KB
-
 RivneOblastPopulationOver65.PNG 354 × 421; 44 KB
-
 RivneOblastPopulationUnder15.PNG 354 × 421; 43 KB
-
 RivneOblastPopulationUnder15toOver65.PNG 356 × 433; 45 KB
-
 RokytneRaion1989-2001dynamics.PNG 727 × 900; 26 KB
-
 Roma19892001dynamics.PNG 571 × 434; 35 KB
-
 Roma2001urbanization.PNG 564 × 418; 34 KB
-
 Romanlang2001ua.PNG 571 × 434; 39 KB
-
 RuralChange2005-2010Ukr.png 566 × 446; 42 KB
-
 RuralPopChangeUkraine1989-2010.PNG 571 × 434; 34 KB
-
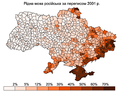 Russianlang2001ua.PNG 571 × 434; 43 KB
-
 Russians in Ukraine 1989.PNG 800 × 559; 194 KB
-
 Russians in Ukraine 2001.PNG 800 × 559; 182 KB
-
 Russians Ukraine 2001.PNG 1,181 × 825; 76 KB
-
 Sharemen1959ua.PNG 571 × 434; 40 KB
-
 Sharemen2001ua.PNG 571 × 434; 42 KB
-
 Sverdlovsk Ukraine-map.png 800 × 533; 146 KB
-
 UaAging2010.png 607 × 481; 35 KB
-
 UaBirth2009.PNG 571 × 434; 42 KB
-
 UaBirthRate09.PNG 571 × 434; 34 KB
-
 UaDeathrate2010.PNG 567 × 458; 42 KB
-
 UaDiv2009.png 571 × 434; 35 KB
-
 UaFirstNationality2001 ru.PNG 589 × 438; 45 KB
-
 UaFirstNationality2001-Fr.jpg 560 × 424; 325 KB
-
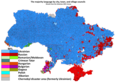
 UaFirstNationality2001.PNG 589 × 438; 40 KB
-
 UaMediumAge2010.PNG 571 × 434; 35 KB
-
 UaMigration2009o.png 571 × 434; 30 KB
-
 UaMigration2009r.png 571 × 434; 45 KB
-
 UaMigrGrowth.PNG 571 × 434; 38 KB
-
 UaNaturalGrowth09.PNG 571 × 434; 42 KB
-
 UaNaturalGrowth1990.PNG 571 × 434; 34 KB
-
 UaNaturalGrowth1995.PNG 571 × 434; 33 KB
-
 UaNaturalGrowth2000.PNG 571 × 434; 32 KB
-
 UaNaturalGrowth2005.PNG 571 × 434; 33 KB
-
 UaNaturalGrowth2010.PNG 571 × 434; 32 KB
-
 UaPopulation1897-1913.PNG 539 × 386; 28 KB
-
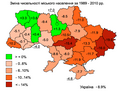
 UaPopulation1989-2001.PNG 571 × 434; 46 KB
-
 UaPopulation1989-2014.png 1,060 × 878; 68 KB
-
 UaPopulation2002-2006.PNG 571 × 434; 43 KB
-
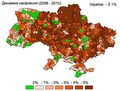 UaPopulation2006-2010.PNG 571 × 434; 44 KB
-
 UaPopulation2010-2014.PNG 571 × 434; 48 KB
-
 UaPopulationDynamics197079.PNG 571 × 435; 45 KB
-
 UaPopulationElderAge.png 571 × 434; 22 KB
-
 UaPopulationUnder15.PNG 571 × 434; 22 KB
-
 UaSecondNationality2001.PNG 589 × 481; 46 KB
-
 UaThirdNationality.PNG 592 × 464; 50 KB
-
 UaUrbanDynamics7089.PNG 571 × 434; 43 KB
-
 Ukraine - Kurdish population (2001).svg 550 × 380; 732 KB
-
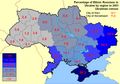
 Ukraine census 2001 Russian.svg 621 × 477; 796 KB
-
 Ukraine census 2001 Ukrainian.svg 620 × 477; 840 KB
-
 Ukraine census 2001 Ukrainians.svg 605 × 465; 533 KB
-
 Ukraine City's Population Dynamics.PNG 571 × 434; 46 KB
-
 Ukraine ethnic 1897.png 968 × 506; 960 KB
-
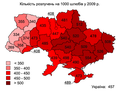
 Ukraine natural population growth rates.png 707 × 567; 87 KB
-
 Ukraine Population Dynamics 1970-2010.PNG 571 × 434; 44 KB
-
 Ukraine-crimes-per10k-popul-map.png 1,181 × 825; 61 KB
-
 Ukraine-death-rate-suicides-by-region.png 1,025 × 833; 102 KB
-
 UkraineNativeLanguagesCensus2001detailed hu.svg 2,500 × 1,720; 4.82 MB
-
 UkraineNativeLanguagesCensus2001detailed-en.png 2,500 × 1,720; 4.03 MB
-
 UkraineNativeLanguagesCensus2001detailed.PNG 2,500 × 1,720; 3.82 MB
-
 UkraineOver65age.PNG 574 × 403; 29 KB
-
 UkrainePopulation1926.PNG 571 × 434; 17 KB
-
 UkrainePopulation1939.PNG 571 × 434; 22 KB
-
 UkrainePopulation1959.PNG 571 × 434; 22 KB
-
 UkrainePopulation1989.PNG 571 × 434; 22 KB
-
 UkrainePopulation2014.PNG 571 × 434; 22 KB
-
 UkrainerDonezk.png 800 × 600; 220 KB
-
 UkraineUnder14age.PNG 574 × 403; 30 KB
-
 UkraineUrbanization2010.PNG 571 × 434; 41 KB
-
 Ukrainian-as-native.gif 1,172 × 683; 91 KB
-
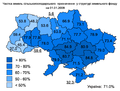
 Ukrainianlang2001ua.PNG 571 × 434; 44 KB
-
 Ukrainians1948.jpg 1,138 × 665; 210 KB
-
 UkrainiansNonUkrainianLang1926.PNG 864 × 730; 65 KB
-
 UkrainianSSR Population Change 1970 1989.PNG 573 × 444; 45 KB
-
 UkrBitrhM.PNG 571 × 434; 26 KB
-
 UkrBitrhUnmarried.PNG 571 × 434; 27 KB
-
 UkrLifeExpectancy.PNG 570 × 427; 32 KB
-
 UkrLifeExpectancy2007-2008.PNG 571 × 434; 29 KB
-
 UkrnsRural1989.PNG 571 × 434; 33 KB
-
 UkrnsRural2001.PNG 571 × 434; 35 KB
-
 UkrnsUrban1989.PNG 571 × 434; 34 KB
-
 UkrnsUrban2001.PNG 571 × 434; 36 KB
-
 Ukrs1897literacy.PNG 553 × 446; 30 KB
-
 UkSSR Popukation 1970 1989.PNG 571 × 434; 43 KB
-
 UrbanChange2005-2010Ukr.png 566 × 446; 41 KB
-
 Urbanization.PNG 571 × 434; 40 KB
-
 Urbanization1897ua.PNG 553 × 446; 31 KB
-
 Urbanization1926ua.PNG 822 × 624; 142 KB
-
 UrbanPopChangeUkraine1989-2010.PNG 571 × 434; 34 KB
-
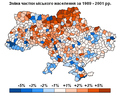 UrbanRateChange1989-2001ua.PNG 566 × 442; 40 KB
-
 Ussr natrep 89.jpg 1,364 × 1,234; 244 KB
-
 VillageMediumPopulatUa.PNG 571 × 451; 43 KB
-
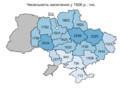
 Білоруси в Україні.png 1,220 × 795; 47 KB
-
 Густота населення.png 8,500 × 5,500; 1.96 MB
-
 Місце народження українських міністрів першого уряду Федіра Лізогуба.png 1,024 × 688; 151 KB
-
 Мережа сайтів АБО.png 1,600 × 900; 159 KB
-
 Место рождения Украинских министров правительства Гройсмана.svg 1,547 × 1,041; 917 KB
-
 Министры второго правительства Яценюка.svg 1,547 × 1,041; 917 KB
-
 Министры первого правительства Яценюка.svg 1,547 × 1,041; 917 KB


.svg)


