Category:Economic statistics for Germany
Subcategories
This category has the following 7 subcategories, out of 7 total.
Media in category "Economic statistics for Germany"
The following 59 files are in this category, out of 59 total.
-
 2006German exports.PNG 1,425 × 625; 62 KB
-

-
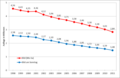 Auflage Bild (1998-2011).png 1,069 × 692; 48 KB
-
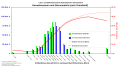
 Ausgangdatenreihe - Flugverkehr innerhalb von Deutschland 02.2019.png 2,175 × 624; 53 KB
-
 BRDSchuKrise.png 960 × 595; 28 KB
-
 BRDSchuKriseEngl 01.png 960 × 594; 29 KB
-
 Bruttoinlandsprodukt.pdf 1,752 × 1,239; 264 KB
-
 BruttostaatsschuldenEuro.png 958 × 593; 29 KB
-
 BruttostaatsschuldenEuroEngl.png 958 × 593; 30 KB
-

-
 Erzeuger- und Verbraucherpreise.svg 800 × 600; 15 KB
-
 ESt Statistik D Einkünfte Steuersätze Grundtarif 2010.svg 1,500 × 800; 45 KB
-
 ESt Statistik D Einkünfte Steuersätze Grundtarif 2014.svg 1,500 × 850; 55 KB
-
 ESt Statistik D Einkünfte Steuersätze Splittingtarif 2010.svg 1,500 × 800; 45 KB
-
 ESt Statistik D Einkünfte Steuersätze Splittingtarif 2014.svg 1,500 × 850; 55 KB
-
 ESt Statistik D Steuerpflichtige Grundtarif 2010.svg 1,500 × 800; 32 KB
-
 ESt Statistik D Steuerpflichtige Grundtarif 2014.svg 1,500 × 850; 45 KB
-
 ESt Statistik D Steuerpflichtige Splittingtarif 2010.svg 1,500 × 800; 32 KB
-
 ESt Statistik D Steuerpflichtige Splittingtarif 2014.svg 1,500 × 850; 45 KB
-
 ExImUSAJBRD.PNG 960 × 594; 57 KB
-
 ExImUSAJFRG.png 960 × 594; 47 KB
-
 Firmenpleiten.svg 1,000 × 600; 10 KB
-
 GermanImports USSRPerCent.jpg 907 × 650; 133 KB
-
 Germany Export Treemap.jpg 2,670 × 2,086; 2.09 MB
-
 Germany Product Export Treemap.jpg 1,103 × 859; 704 KB
-
 Global Investment in U.S. Real Estate, by Country.PNG 857 × 460; 41 KB
-
 GoodwinEmpBRD.PNG 977 × 631; 41 KB
-
 Gv-mais-eu.PNG 713 × 528; 18 KB
-
 Ifo-Konjunktur-Uhr.jpg 1,432 × 1,206; 146 KB
-
 InterestRGrowthDiff.PNG 959 × 593; 37 KB
-
 Internationale Wettbewerbsfähigkeit DM.png 790 × 394; 14 KB
-
 KapaAuslUSABRD.png 978 × 633; 58 KB
-
 KapaAuslUSABRDEngl.png 978 × 633; 45 KB
-
 KZinsDiff.PNG 970 × 604; 36 KB
-
 Lohnstruktur Verarbeitendes Gewerbe 2015-09.svg 590 × 458; 204 KB
-
 MEoC.png 977 × 631; 47 KB
-

-

-
 Preisindex für Telekommunikationsdienstleistungen.png 1,280 × 720; 30 KB
-
 PreisindizesEngl.png 968 × 614; 35 KB
-
 PreisindizesKonsum.png 968 × 614; 34 KB
-
 Pro-Kopf1976 2006.png 2,500 × 1,840; 43 KB
-
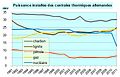 Puiss installée centrales thermq allemandes.jpg 442 × 284; 25 KB
-
 RentUSAGerFraBri 02.png 767 × 625; 22 KB
-
 ShortIntRGrowthDiff.PNG 970 × 604; 37 KB
-
 Staatsschuldenquote Deutschland 1995-2016.pdf 1,754 × 1,239; 29 KB
-
 StaDeficitEngl.PNG 970 × 603; 41 KB
-
 State aid eu germany 2000-2012 euro DE.svg 872 × 444; 89 KB
-
 Steuermodelle ESt Parteien effektiver Steuersatz bis 75000.jpg 1,198 × 748; 304 KB
-
 Tiefkühlkonsum-1.png 2,053 × 1,534; 128 KB
-
 Umsatz der Big Four in Deutschland (in Milliarden).png 642 × 350; 12 KB
-
 Umsatz des Telekommunikationsmarkts.png 1,280 × 720; 52 KB
-
 Umsatzentwicklung der Big Four in Deutschland (in Prozent).png 642 × 385; 14 KB
-
 Verteilung Rotweine Weinbaugebiet Ahr.PNG 591 × 532; 16 KB
-
 Verteilung Weißweine Weinbaugebiet Ahr.PNG 591 × 530; 14 KB
-

-

-
 Wirtschaft Wirtschaftswachstum 2000 2012 a8c943c844.jpg 600 × 474; 30 KB
-
 ZinsWachsDiff.PNG 959 × 593; 21 KB

.png)


_als_Fl%C3%A4chendiagramm.png)


.png)

.png)


.png)
.svg)

