Category:Economic statistics for the United Kingdom
Subcategories
This category has the following 5 subcategories, out of 5 total.
Media in category "Economic statistics for the United Kingdom"
The following 18 files are in this category, out of 18 total.
-
 1999-2014 UK exports destination graph.png 981 × 459; 16 KB
-
 1999-2014 UK exports destination share graph.png 981 × 459; 13 KB
-
 1999-2014 UK foreign trade graph.png 981 × 459; 16 KB
-
 1999-2014 UK foreign trade share graph.png 981 × 459; 14 KB
-
 1999-2014 UK imports origin graph.png 981 × 459; 15 KB
-
 1999-2014 UK imports origin share graph.png 981 × 459; 14 KB
-
 Annual U.K. GDP Growth, 1948 to 2012 (Thatcher) (alt).png 638 × 440; 30 KB
-
 Annual U.K. GDP Growth, 1948 to 2012 (Thatcher).png 638 × 440; 32 KB
-
 Annual U.K. GDP Growth, 1948 to 2012.png 642 × 445; 29 KB
-
 Automobiles production statistics (1960-).png 6,965 × 4,235; 1.6 MB
-
 NewUKDwelling1945 2012ByPurchasingSector.png 1,101 × 764; 269 KB
-
 Phillips curve.jpg 622 × 884; 82 KB
-
 Phillips Curve.svg 512 × 780; 147 KB
-
 Population of England and Wales Fron 1100 to 1900, 1922.jpg 1,126 × 690; 123 KB
-
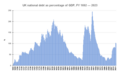 UK debt as GDP percent.png 856 × 529; 38 KB
-
 UK National Debt interest.png 781 × 552; 21 KB
-
 UK National Debt.svg 780 × 478; 41 KB
-


_(alt).png)
.png)

.png)


